This site uses cookies to improve your experience. To help us insure we adhere to various privacy regulations, please select your country/region of residence. If you do not select a country, we will assume you are from the United States. Select your Cookie Settings or view our Privacy Policy and Terms of Use.
Cookie Settings
Cookies and similar technologies are used on this website for proper function of the website, for tracking performance analytics and for marketing purposes. We and some of our third-party providers may use cookie data for various purposes. Please review the cookie settings below and choose your preference.
Used for the proper function of the website
Used for monitoring website traffic and interactions
Cookie Settings
Cookies and similar technologies are used on this website for proper function of the website, for tracking performance analytics and for marketing purposes. We and some of our third-party providers may use cookie data for various purposes. Please review the cookie settings below and choose your preference.
Strictly Necessary: Used for the proper function of the website
Performance/Analytics: Used for monitoring website traffic and interactions
We published a Temkin Group report, The State of Customer Experience Metrics, 2014. This is the fourth year that we’ve published this report on how companies are using CX metrics. Use our CX Metrics Assessment, along with data from large companies, to benchmark your organization’s CX metrics efforts.
We just published a Temkin Group report, State of Voice of the Customer Programs, 2014. In terms of metrics, our analysis shows that satisfaction and Net Promoter Score work most successfully at the relationship level, whereas Customer Effort Score works most successfully at the transactional level.
In the Temkin Group report State of CX Metrics, 2013 , we found that only 11% of large companies feel that they do a very good job of measuring customers’ emotional responses. Emotion is a significant blind spot for most organizations.
We published a Temkin Group report, The State of CX Metrics, 2015. This is the fifth year of this study that examines the CX metrics efforts within large companies. The most commonly used metrics continue to be likelihood-to-recommend and satisfaction, while the most successful metric is interaction satisfaction.
I’ve counted the pageviews of each blog post for 2014 and present them here in my end-of-year summary. Posts also included results of a few research studies that identified key drivers of business growth, biases in customer metrics and redundancy of Net Promoter Scores. blog posts for 2014 were: Got Empathy? :
Related: State of CX Management, 2014 ). Instead of satisfaction, MBUSA wants to delight To measure this objective, MBUSA is changing its metrics to include Net Promoter Score within a basket of other metrics. Related: Customer Effort, Net Promoter, And Thoughts About CX Metrics ). Engage your channel partners.
This is the fifth year of the ratings, here are links to the 2012, 2013, 2014, and 2015 ratings. We just published a Temkin Group report 2016 Temkin Experience Ratings of Tech Vendors that rates the customer experience of 62 large tech vendors based on a survey of 800 IT decision makers from large North American firms.
While retention is closely correlated with concrete metrics like the quality of the product, the utility of the features, and adoption-rates, an equally powerful metric is overall quality of your customer experience. In 2014, Annie was recognized as being one of the 50 most influential CMOs in social media.
They have structured data such as sales transactions and revenue metrics stored in databases, alongside unstructured data such as customer reviews and marketing reports collected from various channels. Your tasks include analyzing metrics, providing sales insights, and answering data questions.
I originally wrote today''s post for Confirmit in November 2014. In November 2014, I participated in the Hooked On Customers Summit , a webinar series hosted by Bob Thompson of CustomerThink. One of the questions posed by Bob during the webinar was: “ How can managers avoid the metric becoming a goal rather than an indicator?
According to their 2014 US Insurance Shopping study, 28% of the Customers who switched auto insurance providers did so because of “poor experience.”. According to Marketing Metrics , you have a much higher probability to sell your existing customers than a new prospect, at 60 to 70% versus 5 to 20%, respectively. 26 August 2014. <
It appeared on the site on September 15, 2014. Marketing Metrics Customer profitability tends to increase over the life of a retained customer. Laura Lake And yet, companies continue to focus on sales, sales metrics, and customer acquisition. Image courtesy of featureset I originally wrote today''s post for InsideCXM.
This post is part of the 2014 CX Day Customer Experience Blog Carnival. Guerrilla metrics in place. There are always multiple moving parts to any customer leadership decision that’s right for your business. The Reality Check Audit pushes the issues you may be grappling with to the surface. Download the 26-page Reality Check Audit PDF.
In a tight space that includes potent competitors like Vine and YouTube, metrics such as this can mean a whole lot when it comes to where companies place their marketing dollars. Inaccurate Customer Service Metrics = A Shaky Foundation. The thing about metrics is that each individual marker on its own is useless.
It appeared on their site on August 12, 2014. Science is metrics and KPIs. When the business focuses on the science side of things, they focus on the metrics; when they are truly customer-focused and customer-centric, there’s art to that because we focus on the customer rather than on moving the numbers. Science is metrics.
It was published on their blog on May 19, 2014. I originally wrote today''s post for Intradiem. Have you thought about this question: "In your company, are customers persona non grata?" OK, a little Latin refresher to start off. What does "persona non grata" mean? According to Wikipedia, it means an unwelcome person. An outcome.
It appeared on their blog on March 17, 2014. You''ll conduct linkage analysis to link customer and employee data, customer feedback with operational metrics, and all data to financial measures. Image courtesy of fuzzedbuzz I originally wrote today''s post for Intradiem. What is big data? Data must be synthesized.
Four years ago, we reported that Americans would spend a forecasted $600 billion during the 2014 holiday season. It may be that a reduced incident rate will be more important than a reduced average length of a phone call, so adjust your metrics as necessary. In 2018, that number has skyrocketed to a massive $1.1 Bring it.”
Therefore respond with a simple summary of a few current metrics of your brand in comparison to two or three of your major competitors. This post is adapted from an article which first appeared on C3Centricity in 2014. See the original.
In 2014, Peter Kriss of the Harvard Business Review reported that happy customers spend up to 140% more than those who had a negative experience. Find out more about how Lumoa can give your organization the insights it needs to determine the most important customer experience metrics and how to act on them. Define the opportunity.
Back in May 2014, I wrote a post titled The Connection Between Customer Satisfaction & Stock Price. The American Customer Satisfaction Index (ACSI) had recently made headlines, along with a 13-year financial analysis of the publicly traded companies in the index.
The answer varies for different companies, but the customer success team performance metrics below are an excellent place to start. As a customer success team leader , these metrics provide a solution to demonstrate the value of your customer success team to top executives and other teams. Customer Financial Metrics.
Between 2014 and 2018 the average office worker received about 90 emails a day —and that’s just to their work inbox. If you work for a company that thrives on transparency, feel free to tell your customers what metrics you are hoping to better understand by sending out the survey. Create an enticing subject line.
Analytics in the data-powered contact center are proven to drive KPIs across key metrics, including first contact resolution, cross promotions and overall customer satisfaction. The Aberdeen Group, Omer Minkara, May 2014). As customers become more empowered through technology, so must the organizations that serve them.
This can be done by tracking actionable customer usage metrics and using adoption analytics to shape the customer experience at different points in their life-cycle journey. Most customer success metric fall into one of these four categories: Customer Usage Metrics. Customer Financial Metrics. Customer Heath Metrics.
CSAT and NPS are both important metrics, but they don’t reveal the attitude, emotion and intent of customers. Third, it’s become susceptible to manipulation since gaining traction, as many companies started tying bonuses to these metrics, thereby incentivizing staff to game the system. Give NPS and CSAT some context.
Check out our Ultimate Guide to Customer Service Metrics Cheat Sheet for how to measure customer support performance metrics today. . Why Is It Important to Measure Customer Service KPIs and Metrics for Telecom Companies? KPIs aren’t metrics collected just for the sake of data. 5 Top Telecom Customer Service KPIs.
Now more than ever, customer success leaders must use relevant and actionable customer success metrics to make guided decisions and strategies to deliver success. Out of the myriads of customer data that can be measured, in this blog, I will emphasize the most important customer success metrics you need to focus on based on best practices.
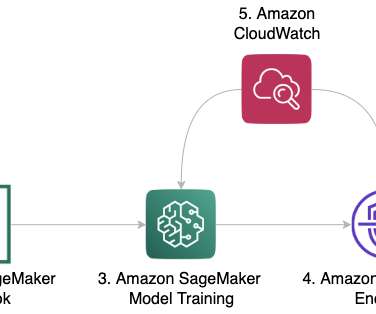
The input data is a multi-variate time series that includes hourly electricity consumption of 321 users from 2012–2014. Amazon Forecast is a time-series forecasting service based on machine learning (ML) and built for business metrics analysis. For HPO, we use the RRSE as the evaluation metric for all the three algorithms.
Those silos are accountable to different leaders and metrics, and that lack of one-company leadership creates inconsistencies for the customer and how they experience your product. Oftentimes, companies have ‘digital’ and ‘traditional operations’ as different silos.
It may be that a reduced incident rate will be more important than a reduced average length of a phone call, so adjust your metrics as necessary. Several years ago, during the relentless Polar Vortex, we made t-shirts for our team saying “Winter Suffer Fest 2014. How will the holiday spike impact your SLA and KPIs? Bring it.”
This can be done by tracking actionable customer usage metrics and using adoption analytics to shape the customer experience at different points in their life-cycle journey. Most customer success metric fall into one of these four categories: Customer Usage Metrics. Customer Financial Metrics. Customer Heath Metrics.
This can be done by tracking actionable customer usage metrics and using adoption analytics to shape the customer experience at different points in their life-cycle journey. Most customer success metric fall into one of these four categories: Customer Usage Metrics. Customer Financial Metrics. Customer Heath Metrics.
In my post last year, I named 2014 “ The Year of Empathy.” Although I published 13 CX trends for 2013 and 14 CX trends for 2014 , I decided that 15 trends for 2015 would be too many to track. They will also replace efficiency metrics, such as average handle times, with more customer-oriented measures.
Launched in 2014, Typeform has already reached over 1.5 Our Customer Success mission statement is to “ retain and grow our customers by helping them achieve their goals ” and our metrics is Net MRR Churn. Our biggest challenge is tracking the impact of the actions we take on our metrics. Our growth has been crazy!
Every customer success metric you can measure falls into one of these four categories: Customer Health Metrics. Customer Financial Metrics. Customer Usage Metrics. Customer Success Team Performance Metrics. In this blog series, we’ll examine each customer success metric category in separate blogs.
Every customer success metric you can measure falls into one of these four categories: Customer Health Metrics. Customer Financial Metrics. Customer Usage Metrics. Customer Success Team Performance Metrics. In this blog series, we’ll examine each customer success metric category in separate blogs.
This is the fifth year of the ratings, here are links to the 2012, 2013, 2014, and 2015 ratings. We just published a Temkin Group report 2016 Temkin Experience Ratings of Tech Vendors that rates the customer experience of 62 large tech vendors based on a survey of 800 IT decision makers from large North American firms.
Now more than ever, customer success leaders must use relevant and actionable customer success metrics to make guided decisions and strategies to deliver success. Out of the myriads of customer data that can be measured, in this blog, I will emphasize the most important customer success metrics you need to focus on based on best practices.
Now more than ever, customer success leaders must use relevant and actionable customer success metrics to make guided decisions and strategies to deliver success. Out of the myriads of customer data that can be measured, in this blog, I will emphasize the most important customer success metrics you need to focus on based on best practices.
NPS ® has grown into one of the most popular customer experience metrics, which is why so many people are using this blog as a source for insights into how to best use it. 14 Customer Experience Trends for 2014 (The Year of Empathy) (December 2013).
CXU originally developed its CX programs following the rubric issued by CXPA in 2014. New questions were written to assure current job tasks, skills, and abilities were represented based on contemporary CX practice.”. CXPA revised its rubric after commissioning a detailed 2020 job analysis study.
For an executive team that routinely puts numbers before anything else, add in numbers that measure the impact that your efforts in customer experience are having on a particular metric. www.psychology.today.com 1 August 2014. 10 August 2014. How to Get People to Do What You Want.” Blogs Expert''s Insights'
We organize all of the trending information in your field so you don't have to. Join 97,000+ users and stay up to date on the latest articles your peers are reading.
You know about us, now we want to get to know you!
Let's personalize your content
Let's get even more personalized
We recognize your account from another site in our network, please click 'Send Email' below to continue with verifying your account and setting a password.


Let's personalize your content