This site uses cookies to improve your experience. To help us insure we adhere to various privacy regulations, please select your country/region of residence. If you do not select a country, we will assume you are from the United States. Select your Cookie Settings or view our Privacy Policy and Terms of Use.
Cookie Settings
Cookies and similar technologies are used on this website for proper function of the website, for tracking performance analytics and for marketing purposes. We and some of our third-party providers may use cookie data for various purposes. Please review the cookie settings below and choose your preference.
Used for the proper function of the website
Used for monitoring website traffic and interactions
Cookie Settings
Cookies and similar technologies are used on this website for proper function of the website, for tracking performance analytics and for marketing purposes. We and some of our third-party providers may use cookie data for various purposes. Please review the cookie settings below and choose your preference.
Strictly Necessary: Used for the proper function of the website
Performance/Analytics: Used for monitoring website traffic and interactions
Average Speed of Answer (ASA) This metric measures the time it takes for an agent to answer an incoming call. In the call center industry, the standard time to answer is 20 seconds or less. A lower ASA improves the contact center experience by reducing waittimes. A fast response time improves customer satisfaction.
Call performance data can also reveal inefficiencies in call management, waittimes, and workflows to further help you balance available resources (agents) with demand. For example, if youre struggling with long waittimes, then you either need your agents to process calls more quickly or you need more agents.
They connected Comm100 Live Chat to their CRM, enabling their agents to get detailed information about each player, including their spending patterns, before engaging them. It enables agents to respond to queries in seconds, minimizing waittimes and resolving issues quickly.
Supervisors also provide a connection between organizational leadership and frontline agents, ensuring that high-level goals translate into action. Workforce planners: These specialists forecast call volume and customer demand, and optimize agent scheduling to ensure adequate staffing levels and minimize customer waittimes.
Keep your average response time low. A high response time can lead to high abandonmentrates and customer dissatisfaction. Kicking off our list of live chat best practices for customer service, we’ve outlined some key steps you can take for a faster response time: 2. Be clear about waittime.
Reduce customer waittimes and enhance issue resolution speed. Average Handle Time (AHT): Optimize call duration for efficiency. Call AbandonmentRate: Reduce dropped calls with better staffing and routing. Agent Utilization Rate: Ensure proper workload distribution for better efficiency.
It is also worth noting that call abandonment has a direct impact on customer satisfaction. Call waitingtime is one metric that tends to define the quality of a customer’s experience and that of the service. It is therefore not unexpected that a high call abandonmentrate and a poor client satisfaction rate coexist.
Reducing call abandonmentrate means connecting more with customers in a less impersonal way. At the same time, the most effective customer engagement strategies are available in the communication technology space. What is the Call AbandonmentRate for Contact Centers?
Monitoring Real-Time Performance A dashboard provides live data on aspects like call availability and agent efficiency. This real-time data collection enables immediate improvements where necessary. It visualizes how certain metrics change over time to help teams make informed decisions. It highlights areas of improvement.
Tracking first call resolution ensures that you are satisfying customers in the shortest amount of time, without the need for any follow-up. Average WaitTime : Average waittime tracks how long it takes for customers to connect with an agent who can address their needs. Operational Efficiency.
Cutting waittime, reducing operational costs, and improving conversions are just some of the customer service superpowers already enabled by AI. Chatbots can start a chat when they detect a customer stumbling through the site or showing potential signs of cart abandonment. Their target market shot up, literally overnight.
Sometimes those calls are abandoned. In this post, we’ll look at how Talkdesk calculates abandonmentrate, give you benchmarking metrics for specific industries and walk through how your team can improve your abandonmentrate to service customers better. Average AbandonmentRate. Routing is optimized.
It is in this regard that contact center managers can trace the key metrics around average call handling time, waittimes, call abandonmentrates, and customer satisfaction. Connecting Call Centers to Success. They drive informed decisions from the data to ensure continuous improvement across operations.
Call abandonmentrate. Call waittime. — — — — — — — — — — — —. This metric looks at the total number of times your customers interact with your support team across any channel that you support. . — — — — — — — — — — — —. Call abandonmentrate. What is call abandonmentrate?
Live chat software can help you improve customer satisfaction, by reducing waittimes and personalizing interactions with your customers, for instance. In a report by BI Intelligence , it was found that in 2013 up to 74% of online shopping carts were abandoned, totaling more than $4 billion in product abandonment!
It involves harnessing advanced technology, specifically artificial intelligence and machine learning, to enhance the way businesses connect with their customers. By making the checkout process quick and secure, AI reduces cart abandonmentrates and fosters trust in online transactions.
Improving Efficiency It is estimated that a salesperson makes 52 calls daily (with 15% of the time dedicated to leaving voicemails). In a regular set-up, where agents manually select, dial, and wait for the call to connect is estimated that a total of 36 hours is being wasted each month – per rep.
1) ABANDONMENTRATE The number of callers that hang up before reaching an agent is referred to as the abandonrate. There is a possibility that your abandonmentrate is high because of some issues affecting your agents. . #5) We have listed the top call center performance metrics below. #1)
1) ABANDONMENTRATE The number of callers that hang up before reaching an agent is referred to as the abandonrate. There is a possibility that your abandonmentrate is high because of some issues affecting your agents. . #5) We have listed the top call center performance metrics below. #1)
Phone waittimes can vary, and many people don’t like having one ear ‘on’ as they wait for customer support. Do you have high shopping cart abandonrates? Connect With Kustomer. People who engage in chat are also spending about 60% more per purchase than those who do not. Live chat can help fix that.
Just as service reps are adjusting to the “new normal” of working from home, they’re seeing spikes in call volumes with historically-long waittimes, high call abandonrates, higher rates of customer churn, and (predictably) lost revenue. AI Makes Your Knowledge Base Smarter, Personalized.
In times where doing more with less is critical, the first place a business should look to save costs is with their people and their processes. A more productive contact center will have shorter waittimes and higher First Contact Resolution rates, usually leading to increased customer satisfaction.
It is challenging to offer a good customer experience when customers hate long waittimes. And the primary cause of criticism when contacting a brand via social media is the long waittime. Eliminates long waittimes According to Bloomberg, Customer-service waittimes are three times higher in the United States.
Even before customers engage with an agent, customers judge your company based on how long they remain on hold—and how you communicate waittimes. First Response Time (FRT) This KPI gauges the amount of time a customer must wait before connecting with an agent.
Behind the curtain, it is about connecting the dots between hiring, training, implementing systems, intraday management and delivering on promised service levels while creating memorable experiences. Your staff is THE connection to your customers - create the space for feedback and suggestions that will better customer experience.
Behind the curtain, it is about connecting the dots between hiring, training, implementing systems, intraday management and delivering on promised service levels while creating memorable experiences. Your staff is THE connection to your customers - create the space for feedback and suggestions that will better customer experience.
The Average Handling Time is frequently impacted by typical difficulties like agents having to transfer between multiple computer systems or platforms, computer systems being sluggish, and the agent not having access to the customer’s history. Why is the abandonmentrate important? How to decrease the AbandonmentRate ?
The Average Handling Time is frequently impacted by typical difficulties like agents having to transfer between multiple computer systems or platforms, computer systems being sluggish, and the agent not having access to the customer’s history. Why is the abandonmentrate important? How to decrease the AbandonmentRate ?
Acording to the Baymard Institute, the cart abandonmentrate for all industries averages at around 70% , which means that most potential buyers are walking away before clicking “checkout.” Understanding why customers abandon their carts is key for reducing this rate and boosting conversions.
When you take the time to understand and address customers by their names, acknowledge their preferences, and offer tailored solutions, you create a genuine connection. Customers view your business as one that values personal connections, setting you apart from competitors.
Increased abandonrates. Customers will only wait so long in the queue before they give up. So, staffing shortages don’t just increase abandons, they also increase volume, which can back up queues even more. Agents just need a browser and a good Internet connection to be up and running. Over and over.
Also, because of the predictive mode, call centers regularly see a significant drop in call waitingtimes , which eventually leads to a reduction in abandoned calls. If it has, be sure to give a shout-out, maybe share it with your connections on LinkedIn – it helps a lot!
Videoconferencing is an effective way to improve the connectivity of remote team members. This will allow you to evaluate all missed calls, average waitingtimes, and abandoned calls by your new agents. Response time. This indicator refers to the time the customer waits before being answered.
Here are some examples of KPIs: Call AbandonmentRate The call abandonmentrate is the percentage of outbound calls when the caller hangs up before being connected. An abandoned call is frequently the result of an excessively long waittime – often more than 3 rings.
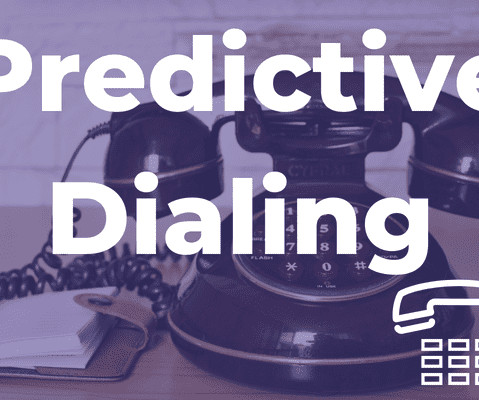
Predictive dialers occupy a cornerstone place in every outbound calling strategy as they shorten the time between answered calls, enabling your team to connect with your customers and reach new leads faster. The purpose is to maximize the number of live connections an agent can handle. How do Predictive Dialers Work?
Average Time To Abandonment (ATA) This is the average length of time in the queue that a caller waits in before they abandon their call , sometimes referred to as average patience or average call abandonmentrate.
She could look at the data and conclude the customer was satisfied because of call length, issue resolution, or minimum waittime. What numbers wouldn’t pick up on is the agent’s patience as the customer asked for clarification several times or empathy as the customer explained why they urgently needed a replacement part.
Everything you need for a fully functioning contact center is an internet connection and a headset. Your teams will appreciate the time saved, which increases metrics such as Average Handling Time , Contact Rate, and Average Waitingtime.
The contact center transfers the call from one platform to the other, wasting everyone’s time. On the one hand, long waittimes hurt the general customer experience and satisfaction. Increasing client satisfaction by minimizing waitingtime; over time Developing brand loyalty and achieving customer engagement.
HelloFresh’s chatbot Freddy has reduced average customer waittime on social customer care channels by 38%, despite a 44% increase in total conversations. Freddy also managed to bring in five times more daily users than average in a Black Friday promotion. An effective channel so far. Public Service. North Charleston, S.C.
The potential barriers could be unclear or unattractive product displays, high prices or perceived lack of value, inadequate product selection, inconvenient store layout or location, unsatisfactory customer service, long waittimes, or difficulty in finding desired products. Don’t let this be your story.
These tips will help you ask the right questions, connect better with your customers, and turn feedback into fuel for growth. Satisfaction here is essential for retaining customers and reducing cart abandonmentrates. Remember, every response is an opportunity to grow, improve, and connect with your audience on a deeper level.
We organize all of the trending information in your field so you don't have to. Join 97,000+ users and stay up to date on the latest articles your peers are reading.
You know about us, now we want to get to know you!
Let's personalize your content
Let's get even more personalized
We recognize your account from another site in our network, please click 'Send Email' below to continue with verifying your account and setting a password.


Let's personalize your content