This site uses cookies to improve your experience. To help us insure we adhere to various privacy regulations, please select your country/region of residence. If you do not select a country, we will assume you are from the United States. Select your Cookie Settings or view our Privacy Policy and Terms of Use.
Cookie Settings
Cookies and similar technologies are used on this website for proper function of the website, for tracking performance analytics and for marketing purposes. We and some of our third-party providers may use cookie data for various purposes. Please review the cookie settings below and choose your preference.
Used for the proper function of the website
Used for monitoring website traffic and interactions
Cookie Settings
Cookies and similar technologies are used on this website for proper function of the website, for tracking performance analytics and for marketing purposes. We and some of our third-party providers may use cookie data for various purposes. Please review the cookie settings below and choose your preference.
Strictly Necessary: Used for the proper function of the website
Performance/Analytics: Used for monitoring website traffic and interactions
Average Speed of Answer (ASA) This metric measures the time it takes for an agent to answer an incoming call. In the call center industry, the standard time to answer is 20 seconds or less. A lower ASA improves the contact center experience by reducing waittimes.
Why Analyzing Call Center Performance Is Important Not yet convinced that analyzing call center performance is worth the effort? Call performance data can also reveal inefficiencies in call management, waittimes, and workflows to further help you balance available resources (agents) with demand. But which is it?
To truly improve the customer experience, you need to combine NPS with metrics like Customer Satisfaction (CSAT), Customer EffortScore (CES), or overall experience ratings to evaluate specific interactions. But knowing the score is just the starting point. Example: A SaaS company tracks CES scores during onboarding.
As a result, good customer experiences enhance an insurer’s brand reputation management efforts. For instance, by utilizing chatbots to quickly respond to customer complaints, companies can save hours’ worth of time that can be invested into building rich customer relationships. It enhances operational efficiency.
But it is notoriously challenging to connect our individual efforts to clear benefits and ROI, because CX can span so many areas. Defining What Customer Experience ROI Looks Like There are countless ways to show the value of your CX efforts. Dont worry: It does get easier with a solid strategy!)
The secret to effortless customer experiences lies in understanding one simple truth: effort matters. Think about the last time you had to navigate a clunky website or deal with a long-winded support call. Thats where Customer EffortScore (CES) steps in to save the day. High scores mean youre on the right track.
Here are the key stages of a typical automation workflow: Data Collection and Integration The first step is to collect and connect customer data from various channels. This automation ensures the right number and type of agents are available at the right time. Companies leveraging omnichannel engagement retain 89% of their customers.
How Can We Prioritize CX efforts? Ultimately, your CX team is there to help with overall governance and prioritization for your CX efforts. These might include simple objectives like “reduce customer waittimes by 25%” or they might include broader goals like “reduce customer effort throughout the customer onboarding process.”
Ultimately, they must all be working in concert with each other, united by clear planning and goal-setting, effective measurement and reporting, and holistic optimization efforts that drive continuousand comprehensivecontact center improvement strategies. They may focus on one particular area or team within the operation.
To assess the current state of your restaurant’s reputation, get your personalized reputation score today! The score is calculated based on customer reviews, response rate, response time, and more. Are diners mostly satisfied with your food quality, ambiance, and waittimes?
Customer EffortScore (CES) Customer EffortScore (CES) is a customer experience metric used to measure customer effort and customer satisfaction. Employee Net Promoter Score (eNPS) Employee Net Promoter Score (eNPS) is a customer experience strategy used to measure employee satisfaction and loyalty.
But also in a broader way to be able to connect unstructured and structured data sources to generate insights from within one platform. customer effort). call history, waittimes, transfers, channel hopping) we can predict the level of effort the customer had to put forth to get their query resolved, all without a survey.
Example: A telecom provider sees high Customer EffortScores (CES) scores in its call center, indicating customers are exerting significant effort to resolve issues. The system identifies three common issues: confusing menu options (CX), long waittimes for delivery (CS), and inconsistent order accuracy (CS).
Listen and subscribe to our podcast: In this episode of the Customer Service Secrets Podcast, Gabe Larsen is joined by Tom Rieger from NSI , to learn about customer retention through enhancing waittimes. The Science of WaitTimes and Rewarding Customers. It seems that many companies are handling waittime wrong.
To provide a quick response time, live chat agents should be online when your customers are and make an (almost) instant connection. While it may take some time to answer a customer’s question or resolve a problem through live chat, the immediate interaction with a customer is key. So, how do you measure customer effortscore?
It can feel like a tug-of-war, where the push to scale revenue, grab a bigger slice of the market, and stay ahead of the competition sometimes clashes with the time, effort, and resources required to ensure customers feel valued and satisfied. Provide convenience and speed: Long waittimes and cumbersome processes are deal-breakers.
While there are many different metrics within a VoC program, two very prominent ones are Customer Satisfaction Score (CSAT) and Net Promoter Score (NPS). The Customer Satisfaction Score (CSAT) is typically related to a specific interaction. In essence, VoC gives your customers a voice within your organization. .
Leading customer experience efforts within a larger business strategy can offer a blueprint for fostering customer loyalty, enhancing customer (and employee) retention, and ultimately, driving brand loyalty. And these efforts can significantly impact business outcomes. CEM is no different, but tracking metrics alone is not a strategy.
Thanks to its speed and convenience, live chat software empowers agents to provide the type and quality of support that today’s consumers need, all while: Reducing operational costs Improving efficiency Increasing availability Building stronger connections and Improving customer satisfaction (CSAT). Lower waittimes.
In the contact center, this can also include quality assurance scores and other agent performance insights. Examples include contact center performance data (call volume, waittimes, etc.), Key Features: Advanced speech analytics with real-time call monitoring and alerts. Strong history in analyzing voice interactions.
A call center dashboard is a centralized digital interface providing real-time insights into call center performance. It enables call center management to monitor and analyze key performance indicators (KPIs) like call volume, agent effortscore, and peak-hour traffic. It highlights areas of improvement.
However, many people with that understanding don’t invest the time, effort, or resources needed to actually take action on that understanding. Many leaders will nod along with this conversation, but they lack the true knowledge to put the right time, effort, or resources toward this understanding.
For example, when the UI team meets their goal of simplifying the ordering process, it helps the support team reach their goal of limiting waittimes. Depending on the feedback systems and metrics you have in place, a measurable version of this could be: Increase Promoters by 5%, as measured by our Net Promoter Score program.
It is no rocket science that a great member experience leads to higher member loyalty scores and better member retention. But great experiences are often the ones that connect with members at an emotional level. –> Have a solid, effective and organized system that reduces member waitingtime at your branch.
But also in a broader way to be able to connect unstructured and structured data sources to generate insights from within one platform. customer effort). call history, waittimes, transfers, channel hopping) we can predict the level of effort the customer had to put forth to get their query resolved, all without a survey.
Stores can use various types of surveys to collect experience data, such as Net Promoter Score (NPS), Customer Satisfaction (CSAT), and Customer EffortScore (CES) surveys. Naturally, the higher the score, the more satisfied and loyal customers are. Did customers have to search for too long?
According to Gartner , organizations should strive to deliver low-effort customer experiences because simplicity is the most significant driver of loyalty. In fact, 96% of customers who experience a high-effort interaction become more disloyal compared to just 9% who have a low-effort experience. Sluggish response.
When the retail customer experience exceeds expectations, customers feel a connection with the brand, leading to increased spending and higher lifetime value. Efficient Checkout Process Streamline the checkout process to minimize waittimes and enhance convenience. The average score represents the CSAT score.
How AI is Helping in the Growth Phase: Automating Text Analytics As I have mentioned in this blog series, AI can now analyze thousands of open-ended survey comments, identifying key themes and sentiment without manual effort. AI detects an increase in complaints about long check-in times, even though overall NPS scores remain stable.
Connecting the dots of customer experience. My favorite metric was how they determined the incredible results of reducing waittime. So Comcast made dramatic efforts to improve the waittimes and engaged their employees in the field to help. “Your store dropped 1% in NPS scores this month!”
This metric, along with average resolution time, can show how effective your team is, and indicates how much effort your customers have to put in to get their issue resolved. A high average number indicates the queries are probably not going to the right person straight away, and indicates a high effort customer experience.
When it comes to gauging customer sentiment and loyalty, few metrics enjoy such widespread acclaim as the Net Promoter Score (NPS). But what happens when your NPS score isn’t quite as rocketing as you’d like? So keep reading if you want to get your NPS score back on track and supercharge your CX efforts.
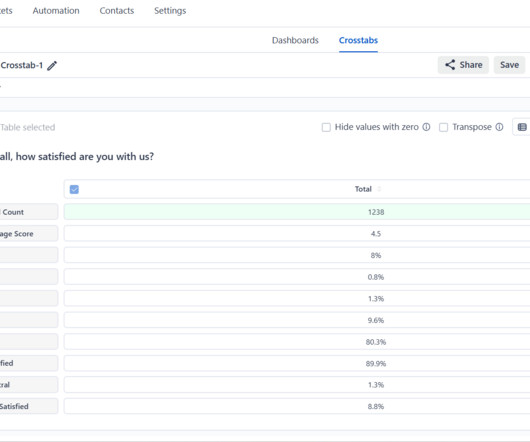
It connects the dots between different variablesbreaking down customer feedback by flight number, region, airport, and even service type. With the help of cross-tabulation, you can spot trends, connections, and patterns that might not be clear from unprocessed survey results right away. Which flights? Which routes?
Much of that advice is a mix of score keeping; being more human and less of a dick; building relationships that matter; solving customer problems; leading with empathy; etc. You call it processing time. The customer sees it as waittime. All good and necessary. Make the employee feel special and appreciated.
Criteria like your company’s Net Promoter Score (NPS) or Customer Satisfaction Score (CSAT) will give you a fair idea of what customers’ opinions are like. Customer effortscore (CES), CSAT, and NPS are examples of metrics applicable in either case. You also need to engage with real customers in the market.
Criteria like your company’s Net Promoter Score (NPS) or Customer Satisfaction Score (CSAT) will give you a fair idea of what customers’ opinions are like. Customer effortscore (CES), CSAT, and NPS are examples of metrics applicable in either case. You also need to engage with real customers in the market.
Why It Helps : Chat and ticketing systems minimize waittime, keeping gamers in the action. How to Measure Success To ensure your customer support efforts are effective, track key metrics: Average Resolution Time: How quickly can your team solve technical issues?
This is where Net Promoter Score comes into play. And an NPS score can be from -100 to 100 and can provide insights into a bank’s overall customer experience. A high NPS score in banking indicates a stronger customer relationship, more referrals, and, therefore, greater growth.
But this doesn’t only mean they want to connect with you via digital channels. Offering multiple communication channels is a must, but only if they are connected to one another within one unified platform. This slows down resolution speed and leads to longer waittimes. The next point explains why. The wrap-up.
Your Net Promoter Score (NPS) isntjust another numberits a direct reflection of customer trust and customer loyalty. Here are 21 actionable strategies to improve your net promoter score and elevate your NPS the right way. Some might cherry-pick respondents, while others could pressure customers into giving a good score.
You may notice errors in communication or confusion in task ownership as a result of teams working in silos, with the result that customers wait too long for service. It’s important to note that the problem—high customer waittimes—is actually the end result of pain points in the employee experience. First things first, though.
The guest experience encompasses all these touchpoints and is part of a larger strategic effort in which customer service plays a crucial part. This means that operators should double down on efforts to ensure that guests feel safe, secure, and clean. A single point of contact doesn’t determine the guest experience.
HCAHPS: Patients’ Perspectives of Care Survey | CMS [1] Initially, HCAHPS scores showed significant improvements. This trend complicates efforts to interpret patient feedback accurately, raising the question: is technology alone sufficient to improve patient experiences?
But this doesn’t only mean they want to connect with you via digital channels. Offering multiple communication channels is a must, but only if they are connected to one another within one unified platform. This slows down resolution speed and leads to longer waittimes. The next point explains why. . The wrap-up .
We organize all of the trending information in your field so you don't have to. Join 97,000+ users and stay up to date on the latest articles your peers are reading.
You know about us, now we want to get to know you!
Let's personalize your content
Let's get even more personalized
We recognize your account from another site in our network, please click 'Send Email' below to continue with verifying your account and setting a password.


Let's personalize your content