This site uses cookies to improve your experience. To help us insure we adhere to various privacy regulations, please select your country/region of residence. If you do not select a country, we will assume you are from the United States. Select your Cookie Settings or view our Privacy Policy and Terms of Use.
Cookie Settings
Cookies and similar technologies are used on this website for proper function of the website, for tracking performance analytics and for marketing purposes. We and some of our third-party providers may use cookie data for various purposes. Please review the cookie settings below and choose your preference.
Used for the proper function of the website
Used for monitoring website traffic and interactions
Cookie Settings
Cookies and similar technologies are used on this website for proper function of the website, for tracking performance analytics and for marketing purposes. We and some of our third-party providers may use cookie data for various purposes. Please review the cookie settings below and choose your preference.
Strictly Necessary: Used for the proper function of the website
Performance/Analytics: Used for monitoring website traffic and interactions
If you believe that you could be getting better support on your customer understanding and insight development, then these ten ideas will take you a long way to doing this in 2019. Top 10 Marketing Infographics to Smash 2018 (Inspiration for the Visual World). These are the most shared marketing infographics of 2017.
Cyber Monday has only been around since 2005, and legend has it, got its name because the average consumer had dial-up internet at home, and would wait to do their online shopping at work, where the internet connection was faster. million small businesses and 112 million consumers participated in the event in 2016. Check it out!
A consumer survey by Imprint Plus found that 32.5% In fact, it’s estimated that by the end of 2018, mobile purchases will represent 27% of all e-commerce purchases. Offer mobile messaging and SMS support. Create dynamic support content. Today, customer service goes beyond the call center. Rinse and repeat.
One study found that customer support requests for sectors including retail and e-commerce have seen the highest increase since late February 2020 — up an average of 48%. People, Business and the Pandemic – Measuring the Long-Term Impact of COVID-19 [An Infographic] by Dhawal Kumar.
recently put together an infographic on live chat that can help illuminate this (find it at the end of this article, or here ). As you’re looking at it, you should note some key stats from the infographic: 60% of consumers dislike being on hold even for just 60 seconds.
Stanton is the Pixar writer and director of both the hit movies Toy Story and WALL-E. I was reminded of his talk because it has since been turned into an infographic on the TED Blog. Well-known examples of heroes include Cinderella or the lovable WALL-E in the film of the same name. SOURCE: CopyPress. split("").reverse().join("");return
recently put together an infographic on live chat that can help illuminate this (find it at the end of this article, or here ). As you’re looking at it, you should note some key stats from the infographic: 60% of consumers dislike being on hold even for just 60 seconds.
As shopping online and e-commerce is currently booming, your business could find itself losing a huge chunk of revenue purely to something as simple as thirty minutes of friendly correspondence and enquiring into the customer’s issue. This infographic was contributed by Braedon Frank. Where are the findings you ask?
Customer self-service tools are a proactive, cost-effective way to provide on-demand support. Recent research shows that this method is so popular that 88% of consumers expect brands to now offer at least one self-service option. High-value downloadable content is a great way to provide consumers with layers of brand information.
Fortunately, as far as live chat reporting is concerned, Velaro has released an infographic that includes stats such as: average time waiting in the queue for live chat, average total chat time, and. That said, every organization that receives that guidance is still left hungry for a sense of what “normal” or “average” might be.
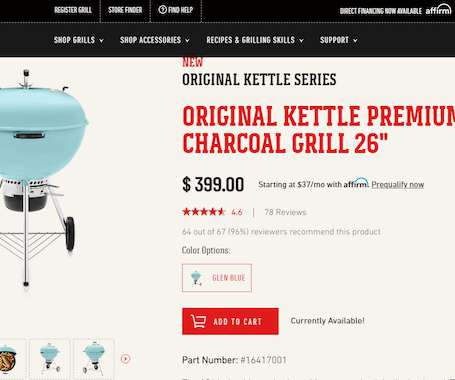
With 93% of consumers making their purchase decision based on website design, product images, and other visual elements of your site, it’s crucial for any online shop or ecommerce business to create a dynamic website that’s optimized for the customers’ shopping experience. . </p><br Bottom line.
In an age in which every customer expects (and demands) experiences tailored to their traits, the need to create masses of high-quality content creates a bottleneck that can jam any brand’s communication flow and send any customer into the arms of e-commerce giants like Amazon. Proofreading and Editing.
Business efforts to satisfy consumers are referred to by the abbreviation “B2C” (Business to Consumer). Although it has a lot in common with consumer marketing activities, it differs in terms of targeted personas, strategy, and tactics. According to Statista’s data , the size of the B2B e-commerce market was $17.9
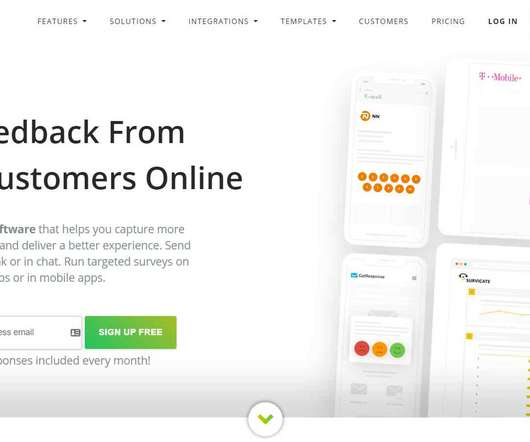
Some may find your customer support slow, while others may find your business ideas redundant. Happy customers are the most vocal supporters of your brand. They tried to reach your customer support but got no response. e) Typeform. e) Feedbackify. Here we go! What Is a Customer Feedback Tool. Source: Typeform.
The Guideline is the result of extended consultation with departments and agencies, and is part of the Treasury Board of Canada Secretariat (TBS)’s efforts to support the development and management of service agreements. You can also download our shorter top 10 rules infographic and keep it handy.
Popular tools like Qualtrics, Medallia, etc are not suitable for the needs of small businesses as they are expensive, and have way too advanced features with extra price and also without any implementation support or CX consultation. It provides ready-made dossiers and visually engaging infographics that summarize key data points and trends.
Ahrefs also provides several online resources, and customer support that provides timely responses to queries. It also offers ‘landing pages,’ e-commerce listing support, templates, automation and integrations with some of the biggest names in e-commerce. They majorly focus on infographics and presentations.
You rely on artificial intelligence when using Waze, Alexa, Siri, facial recognition for phone access, or even your e-mail spam filter. Manually doing these tasks would be time-consuming and error-prone. In addition to tracking consumer data, AI tracks trends, customer behavior, and effective customer engagement options.
Business efforts to satisfy consumers are referred to by the abbreviation “B2C” (Business to Consumer). Although it has a lot in common with consumer marketing activities, it differs in terms of targeted personas, strategy, and tactics. billion in 2021, five times the B2C market.
It’s all about creating a positive consumer experience running through the entire engagement process, at the point of sale and after the sale. This tool also can automate your work as it gathers questions from forums, Q&A sites, Reddit, e-commerce sites. What customer-focused strategy is. BuzzSumo question analyzer.
ecommerce shopping has changed the retail landscape as more and more consumers are looking for convenience, variety, and competitive pricing. As consumers turn to online shopping, their expectations for customer experience also continue to rise. consumers say companies provide a good customer experience. Provide product support.
Dall-E Invideo Audacity Discord Let’s explore how these tools can transform your content creation process. Analyze customer interviews for product insights, consumer sentiment, and feedback. With the right prompts, you can turn text into cover images, infographics, product catalogs, and more for your business. Adobe Veed.io
Th-eir work was published in a paper titled- “ E-Metrics, Business Metrics for the New Economy “ In their customer lifecycle analysis, Jim and Matt stated that Customer Life Cycle starts when you reach your target market and progresses until a loyal customer base is established. Offer Support that Leads to Delightful Customers.
We’re trained to understand the e-space and like to do things on our own. We are put off by the intrusiveness of calls by the customer support executives. Shortly after the launch, their support load was reduced by 20%. #2. A 24-hour support does come in handy here. It’s the technology–driven age. This was in 2014.
Further, statistically proven, 60% of consumers say they’ll subscribe to email promotions from brands, as compared to only 20% that say they’ll check social media for them, making email marketing undoubtedly powerful. Many common content formats, such as infographics, videos, and ebook PDFs, have large file sizes. Tonality and Styling.
Instead, it begins the very first moment that a consumer interacts with your website, follows you on social media, or sets foot in your store. 64% of consumers consider customer experience more important than price when deciding to make a purchase with a brand. Meeting consumer expectations is a challenge. American Express.
Articles, white papers, and e-books. Infographics. Statista reports that 88% of consumers expect brands to have an online self-service portal. You can enhance your self-service support portal with an intelligent, conversational artificial intelligence (AI) chatbot. Supports Different Learning Styles.
We organize all of the trending information in your field so you don't have to. Join 97,000+ users and stay up to date on the latest articles your peers are reading.
You know about us, now we want to get to know you!
Let's personalize your content
Let's get even more personalized
We recognize your account from another site in our network, please click 'Send Email' below to continue with verifying your account and setting a password.


Let's personalize your content