This site uses cookies to improve your experience. To help us insure we adhere to various privacy regulations, please select your country/region of residence. If you do not select a country, we will assume you are from the United States. Select your Cookie Settings or view our Privacy Policy and Terms of Use.
Cookie Settings
Cookies and similar technologies are used on this website for proper function of the website, for tracking performance analytics and for marketing purposes. We and some of our third-party providers may use cookie data for various purposes. Please review the cookie settings below and choose your preference.
Used for the proper function of the website
Used for monitoring website traffic and interactions
Cookie Settings
Cookies and similar technologies are used on this website for proper function of the website, for tracking performance analytics and for marketing purposes. We and some of our third-party providers may use cookie data for various purposes. Please review the cookie settings below and choose your preference.
Strictly Necessary: Used for the proper function of the website
Performance/Analytics: Used for monitoring website traffic and interactions
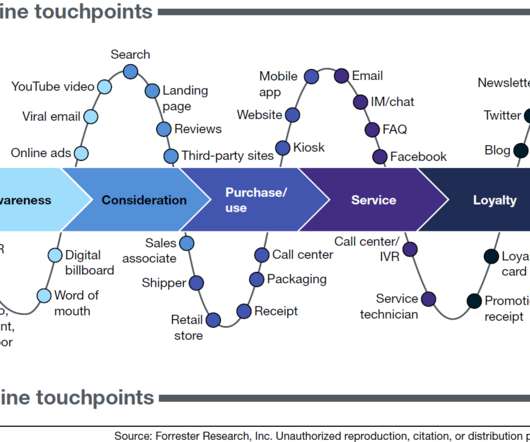
You can download (and print) this infographic in different forms: Infographic: infographic in pdf, infographic in png Poster (12″ x […]. Here’s some interesting data snippets from the recent report, State of VoC Programs, 2016. For additional info, check out our VoC resource page.
Voice of the Customer (VoC) programs are a central part of most customer experience efforts. You can download (and print) this infographic in different forms: Infographic: infographic in pdf, infographic in png Poster (12″ x 24″): poster in pdf, poster in png Filed under: […].
View Infographic. Yet, most companies are still failing to meet customer expectations and become more customer-centric. According to Accenture , this is because there is a growing disconnect between what customers need and what retailers are providing. ” – Keira Henderson, CustomerInsights Researcher, QVC.
Customer experience management (CXM) is essential for organizations to monitor those relationships, evolve along with their customers' changing needs and preferences, and incorporate customerinsights and feedback into their decision-making.
Recently, Lumoa organized a webinar about Insights where we talked about the challenges in identifying emerging trends, root causes, and how to properly close the loop with your customers. This interactive infographic presents excerpts from a webinar in which Garen (Product Marketing Mgr.)
So how do you gather the customerinsight you need? Customer surveys. If done right, surveys can bridge the gap between what content you already provide and what content your customers are looking for. Infographics. infographics, webinars, blog posts) and what tone of voice to use (serious, humorous, formal).
NPS in a nutshell [infographic]. Customer feedback survey placements largely depend on your customers. What is your main channel of communication with your customers? Learn More about customer experience. Don’t collect customer feedback to keep it inside of your company. Where to ask for feedback?
A trove of customerinsights, questions and statistical data can be pulled from these recordings, and it’s just waiting to be analyzed and distributed to the departments where it can make an impact. Top-notch data storage. When you place a call to a contact center, you are often told, “This call may be recorded.”
Companies that leverage the power of innovation and artificial intelligence in listening and responding to customers, will be the next successful brands in the industry. On the contrary, traditional market surveys are no longer capable of providing real-time customerinsights and demand manual efforts.
Use this infographic to explore how the climate crisis affects businesses and how bold action can mitigate your organization's risk exposure. Climate change poses numerous business risks. No industry is immune.
If you have a big growth goal to reach in 2019, you can leverage your customerinsights from your Voice of Customer (VOC) data to achieve it. 4 areas to utilize your customerinsights. So, companies need authentic human insight from their customers to make better business decisions, and thereby drive growth.
The Future is Now: Take Your Customer Data to the Next Level Two Major Flaws of Your Customer Listening Efforts It's a problem. From the 2016 Temkin Group State of Voice of Customer (VoC) Programs Infographic: 34% of companies reported making changes to their business based on customerinsights.
A trove of customerinsights, questions and statistical data can be pulled from these recordings, and it’s just waiting to be analyzed and distributed to the departments where it can make an impact. Top-notch data storage. When you place a call to a contact center, you are often told, “This call may be recorded.”
A trove of customerinsights, questions and statistical data can be pulled from these recordings, and it’s just waiting to be analyzed and distributed to the departments where it can make an impact. Top-notch data storage. When you place a call to a contact center, you are often told, “This call may be recorded.”
(CLICK FOR HIGH RES) The channel technology stack is a group of technologies that brands leverage to manage and improve their indirect sales process and partner programs.
The business risks associated with global climate change are enormously complex and nearly infinite in quantity. Your firm’s climate-related risks, however, are much more manageable (albeit complex and numerous, as well). No two organizations are exposed in exactly the same way.
However, this year has proven there is still a gap in meeting customers’ expectations and data seems to be at the forefront of C-suite discussions over how to truly understand users and customers. Find out what the predictions are for Customer Experience in 2018 by downloading our new infographic.
It is well documented that it costs a lot more to acquire a new customer than it does to keep one. To see the latest numbers on this, I suggest you check out this awesome infographic by Invesp that was recently shared by Neil Davey on MyCustomer. And yet most organisations continue to spend more on acquisition than retention.
Most chances you are familiar with the Marketing Technology Landscape infographic by Chiefmartech, the one with all those thousands of tiny logos, showing the insane growth of the MarTech space over the past decade. For you, the business and marketing decision-maker/professional, this insane wealth of options can be a double-edged sword.
Using high-quality visuals like infographics, videos, and photos stands out more on a newsfeed and can grab users’ attention faster. Enhanced customerinsights and feedback Social media enables businesses to collect meaningful insights via customer feedback.
In their embrace of new tools and tactics, marketers have at times lost sight of the people they aim to connect with. A shift in approach requires no new investment — but it does require revisiting core assumptions.
Todd Wilson, Local business owner & Birdeye customerInsightful analytics Social media platforms offer a treasure chest of data that can help you make informed decisions about your marketing strategies. Articles, images, videos, and infographics keep your audience coming back for more. Create a mix tape of content.
In the recently published Forrester Infographic: Connected Shoppers In Southeast Asia, we share several insights: Shoppers in Southeast Asia are connected and channel-agnostic. Consumers in […].
Hanging prominently in the Museum of Modern Art (MoMA) in New York City is a giant infographic that explores the physical, technical, and social components of modern artificial intelligence. Kate Crawford and Vladan Joler’s 2018 Anatomy of An AI System is a visual essay that spares no detail as it traces the lifecycle of an […]
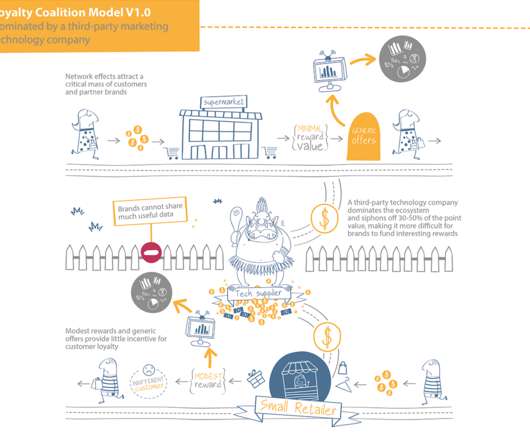
Currency Alliance created these infographics to explain the benefits and limitations of each one, for consumers and for brands. In fact, there have been two distinct iterations of the loyalty coalition model – and a third, game-changing alternative is now emerging. Plan Your Loyalty Strategy for the Next Decade.
Competitor insights 4. Customerinsights 5. Customer experience 6. Respond to customers 7. Track strategies, products, and customer information throughout the industry. CustomerinsightsCustomerinsight using AI is something that Birdeye excels at. Want a quick answer?
The ability to identify data and centralize it for analysis is key; from there, teams can better develop insights and test and learn in real time, encouraging more collaboration and actions rooted in data. In today’s macroenvironment, organizations need to continue making investments in systems and processes, people, and customerinsights.
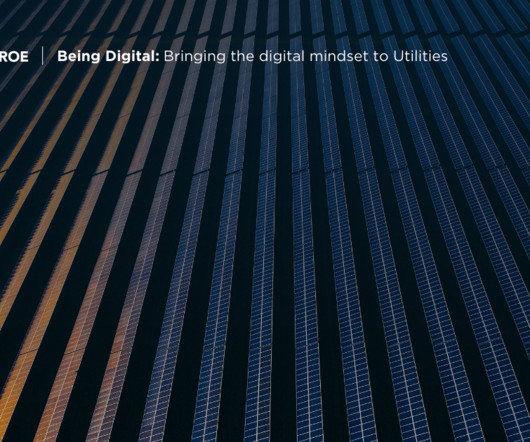
Download the Infographic Digital and Org Design: 4 Insights from Utility Leaders download Insight 1: Utility customers have high expectations, and they are largely not being met Utility customers have understandably high expectations for service.
The main reason: Change management — the intersection of org structure and culture — is the biggest barrier to success in digital experience initiatives (see the “Forrester Infographic: The State Of DX, […].
SurveySparrow’s customer feedback platform empowers businesses to collect, analyze, and act on customerinsights seamlessly. With intuitive survey creation, advanced analytics, and real-time reporting, the tool enables you to unlock the full potential of voice of the customer analytics. You know what?
It provides ready-made dossiers and visually engaging infographics that summarize key data points and trends. SurveySensum is your one-stop shop for getting the customerinsights you need, fast. *Source: G2 , Jun 03, 2023 Best Features The platform provides in-depth industry reports, market studies, and company profiles.
Effective customer feedback surveys require setting clear objectives, choosing suitable question types (e.g., To gather actionable customerinsights, surveys should cover key areas such as product/service satisfaction, customer support experience, pricing perception, and brand loyalty and further be analyzed to drive improvement.
I produce a one-page, printable infographic that summarizes the latest customer feedback. I also make a point to share customer satisfaction stories that are relevant to the executive’s responsibilities. Senior executives are busy people with many obligations. Data is important, but individual stories have a real impact, too.
We hope our new infographics, released through this paper and the following 3 instalments, support your own efforts to build a world-beating loyalty program of your own. This means a transaction is taking place to issue points, but the data about what the customer is actually buying is limited. A world-beating program in travel.
Thanks to supermarkets’ high customer frequency and good data analytics, grocery chains can dynamically apply different points earning levels based on the available margin on each item sold, FMCG/CPG-funded offers, and insight about the share of wallet they are getting from each customer. A winning program in the grocery sector.
The 40-60% of less frequent customers are a far larger commercial opportunity. Capture exclusive customerinsight. Your proprietary data tells you a lot about your most frequent customers. Your teams need to learn how to keep your brand present and relevant, regardless of where the customer is spending their time.
Push your team to capture exclusive customerinsight. Your greatest asset is exclusive customerinsight. You have some data on all customers and may even know a fair amount about some customers. Click here to expand the infographic. Hundreds of those complementary brands also serve your customers.
Michele Pelino and I have been digging into Forrester’s Technographics data, looking at big opportunities for the internet of things (IoT) — and identifying some of the consistent stumbling blocks to adoption.
And with the ubiquity of mobile, Millennials expect a seamless customer experience regardless of the device they’re using. This infographic, from our Black Friday 2013 study , highlights how millennials use mobile devices to shop. ENGAGE MILLENNIALS FOR CUSTOMERINSIGHT. Infographic from our Social to Sale study.
AI-driven insights are helping agencies tailor their strategies, align campaigns closer to client goals, and improve overall impact. of agencies report gaining deeper customerinsights after implementing AI that helps them shape more effective, data-driven campaigns. Better customerinsights: 33.6%
These tools help your business appear in Google Maps and Google Search results, enhancing your visibility for local customers. Insights and analytics Access to data is key for informed decision-making. Google Business Profile management tools provide insights into how customers interact with your business online.
We organize all of the trending information in your field so you don't have to. Join 97,000+ users and stay up to date on the latest articles your peers are reading.
You know about us, now we want to get to know you!
Let's personalize your content
Let's get even more personalized
We recognize your account from another site in our network, please click 'Send Email' below to continue with verifying your account and setting a password.


Let's personalize your content