This site uses cookies to improve your experience. To help us insure we adhere to various privacy regulations, please select your country/region of residence. If you do not select a country, we will assume you are from the United States. Select your Cookie Settings or view our Privacy Policy and Terms of Use.
Cookie Settings
Cookies and similar technologies are used on this website for proper function of the website, for tracking performance analytics and for marketing purposes. We and some of our third-party providers may use cookie data for various purposes. Please review the cookie settings below and choose your preference.
Used for the proper function of the website
Used for monitoring website traffic and interactions
Cookie Settings
Cookies and similar technologies are used on this website for proper function of the website, for tracking performance analytics and for marketing purposes. We and some of our third-party providers may use cookie data for various purposes. Please review the cookie settings below and choose your preference.
Strictly Necessary: Used for the proper function of the website
Performance/Analytics: Used for monitoring website traffic and interactions
The best way to get started is by tracking and monitoring call center metrics. What Are Important Call Center Metrics to Measure? Call center metrics provide insight into the customer experience and quantify agent productivity. Here are 30 important metrics you can track to ensure your call center achieves its goals.
As a result, businesses must double down on efforts to understand their customers’ goals and pain points to drive loyalty. For example, key metrics like CSAT help you improve aspects of your business to satisfy specific customer needs. Thank you Your download will begin shortly. If it doesn’t, click on the download button.
As your company begins to scale customer experience operations, it is possible for silos that cause different departments to use separate technologies and focus on different metrics, which fragments your understanding of the customer experience. Even marketing professionals have successfully led CX operations efforts.
71% of organizations say customer journey mapping has successfully persuaded management to invest in CX efforts and fix existing customer problems. Step 5: Understand Customer Sentiment While customer sentiment is usually a metric reserved for consumers who have already become customers, it can be useful in creating a customer journey map.
To mitigate these challenges, your business should invest time in selecting the right customer experience outsourcing partner, ensuring alignment with their values, and establishing clear performance metrics. These benchmarks will guide your partners efforts and ensure alignment with your business goals. link] Accessed 12/6/2024.
When you start your CX efforts, you need to consider how to measure it. But “it” is a multi-layered concept, and to truly understand customer experience at scale, you may need to track three very important metrics. The Three Most Popular CX Metrics. What Is Net Promoter Score (NPS)? Passives score 7 or 8.
But it is notoriously challenging to connect our individual efforts to clear benefits and ROI, because CX can span so many areas. Defining What Customer Experience ROI Looks Like There are countless ways to show the value of your CX efforts. If customers download your app, how many never make a purchase?
How successful have these efforts been? To find out, Calabrio surveyed hundreds of CX leaders from the around the globe for State of the Contact Center 2025 report. The KPIs t hat m atter m ost a re s hifting The contact center success metrics are evolving beyond traditional efficiency KPIs.
Customer Satisfaction Score (CSAT). Customer Satisfaction scores are an attempt at capturing how satisfied customers are with a company’s goods and services. Net Promoter Score (NPS®). Customer EffortScore (CES). Here are three of the most common types of customer satisfaction surveys or measurements: 1.
Organizations must learn how to measure, manage, and act on customer experience KPIs and metrics so that they can deliver experiences that lead to increased loyalty, lower churn, more referrals, positive word of mouth, and higher-value customers. What Are Customer Experience KPIs and Metrics?
Y ou know your customers are satisfied because the Customer Satisfaction Score (CSAT) that you see on your daily dashboard tells you as much. The score is solid. So, what’s a company to do to earn an even better CSAT score? It’s interesting to take a look at this metric over time. Why isn’t that score higher today?
And, even more importantly, how can you do it so that you get financial proof points, such as proving the ROI of customer experience , from the efforts? Don’t get me wrong, metrics matter, but solely focusing on score management can lead to program stagnation. I have to put on my best poker face (which I do not have!)
Based on data from 218 large organizations with at least $500 million in annual revenues, we examined VoC efforts within large organizations. Despite a slight drop in staffing numbers and executive involvement, companies’ VoC efforts continue to deliver successful results. Download report for $195.
Take NPS from a Score to a Strategic Advantage In today’s fiercely competitive business environment, customer satisfaction is paramount to success. By using the Net Promoter Score system as your compass, you can gain a better understanding of what drives customer loyalty and satisfaction.
Everyone in your organization has the power to create great experiences, but it takes a strategic effort to make the most use of your time and scale your efforts successfully. Youll identify metrics youll track to prove these outcomes, and we explain metrics more below. There are so many places you can focus.
If you’re new to Customer Satisfaction Score (CSAT), a good starting point is seeing how you compare to peers in your industry. Customer Satisfaction Score is 76.5%. Click here to download the current industry benchmarks. Customer Satisfaction Score: A Free Guide. to get a pulse on CSAT across industries. Get the Guide.
The customer effortscore (CES) is a key metric that shows companies how simple or difficult it is for customers to do business with them. It measures how much effort a customer has to put in to use a product or service, acquire information about its usage, or address a problem. Wondering how you can do that?
We have put together a list of key customer service metrics, so you can be sure that your support team is doing the best it can to help your customers. On this page you can see a complete list of all the customer support metrics that matter, and why. Navigate this guide: Productivity metrics. Performance metrics.
We published a Temkin Group report, The State of CX Metrics, 2015. This is the fifth year of this study that examines the CX metricsefforts within large companies. The most commonly used metrics continue to be likelihood-to-recommend and satisfaction, while the most successful metric is interaction satisfaction.
This can include the number of survey responses, metrics over time, most recent online reviews, and more. By consolidating various customer-related metrics into one platform, dashboards facilitate informed decision-making. These metrics help identify customer engagement and any areas of improvement.
In a previous blog, I outlined 14 different metrics that contact centers should be tracking to improve customer experience. However, these metrics are designed to influence real-time decision making in your contact center. What is Customer EffortScore (CES)? What is Net Promoter Score (NPS)? 2) Disagree. (3)
Number of chats Agent utilization rate Average wait time Average chat time First contact resolution Invitation acceptance rate Sales conversion rates Visitor logs and wrap-up notes Customer satisfaction scores. We’ll look more at the average handle time metric later. You can analyze this metric by viewing your chat volume report.
70% of enterprises have begun to significantly increase their investment into customer analytics solutions in order to properly evaluate their CX metrics such as Net Promoter Scores (NPS) and Customer Satisfaction Scores (CSAT). Download your copy here. Need more justification for your CX strategy? About our guest author.
In order to provide high-level customer service while monitoring return on investment, companies need to use some metrics to measure success. The three metrics used for measuring customer experience are NPS, CSat, and CES; the latter measures customer effort and the rest are used to measure customer satisfaction.
Customer churn is a critical metric because it is much less expensive to retain existing customers than it is to acquire new customers. Wondering which metric to choose? metrics Customer metrics are simply measurements used to gauge the customer – whether for loyalty and retention, marketing or new product development.
Depending on the feedback systems and metrics you have in place, a measurable version of this could be: Increase Promoters by 5%, as measured by our Net Promoter Score program. Goals like these help avoid setting unrealistic expectations by saying “we’ll have NPS baseline metrics in 12 months!”
According to Forrester , a one percent increase in CX scores can translate up to $100 million in annual revenue. CX programs often fall back on metrics such as Net Promoter Score to track success, without ever linking back to critical metrics such as churn, lifetime value (LTV) and revenue. Lack of ownership.
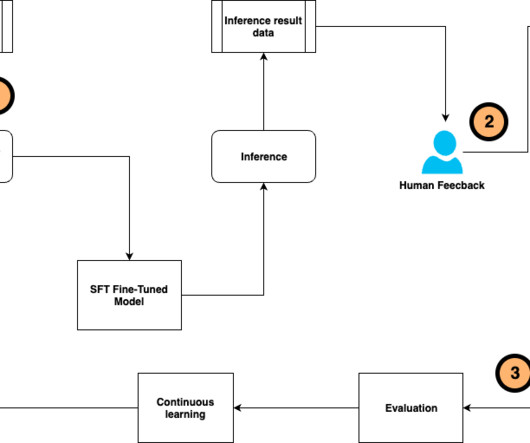
Precise and responsible outputs from fine-tuned LLMs require big efforts from subject matter experts (SMEs). Evaluation and continuous learning The model customization and preference alignment is not a one-time effort. The optimization is on the holistic end-to-end solution, rather than on each component separately.
Quantitative metrics allow you to assign a number to the current state, compare it to the past, and track your company’s progress toward your goals. Customer Satisfaction Score (CSAT) and Net Promoter Score (NPS) are two of the most common tools businesses use to track how happy customers are.
There are a variety of different social media metrics to choose from, and the ones best for your business will depend on your marketing goals. In this article, we’ll tell you about the 13 social media metrics you should track to effectively measure the success of your campaigns. Table of contents What are social media metrics?
You’re going to have to make choices on where to allocate your efforts based on which optimizations will matter the most. Survey for Net Promoter Score (NPS). Your overall NPS score is the percentage of promoter responses minus the percentage of detractor responses. Predictive Forecasting. What impact would that have?
One of those considerations is metrics. Companies that establish thoughtful metrics for their chatbots will find a wealth of resources waiting to help them optimize their live chat offerings. These metrics can be planned – and checked for quality – by comparing them to your existing agent metrics.
Download this Ebook. Thank you for downloading our resource. Customer EffortScore (CES) is a metric used in service interactions, measuring how easy it was for customers to get a resolution to their issue. Not a TM Form. Internal or External. Disable T&Cs requirement. Email intro text.
One of those considerations is metrics. Companies that establish thoughtful metrics for their chatbots will find a wealth of resources waiting to help them optimize their live chat offerings. These metrics can be planned – and checked for quality – by comparing them to your existing agent metrics.
Free Download] 50 Customer Service Training Activities for Live Chat and Telephone Teams. Download Now. It’s essential to build SMART goals here, to allow you to clearly manage your continuous improvement efforts, and ensure your entire team can understand exactly which changes need to be made. Customer Experience Metrics.
To share how to choose, track, and act on effective onboarding metrics, ChurnZero Customer Success Enablement Team Lead Bree Pecci joined CSM Practice for a drill-down into customer-centric onboarding. Onboarding metrics serve two main purposes. Basing onboarding metrics on your internal operations can produce false positives.
If your CX efforts are more about optics than outcomes, that’s a problem. This worksheet helps you move beyond surface-level metrics to create meaningful customer impact. Let’s dig in. Why is your CX strategy even a thing? To hit some quick KPIs? To look like you’re keeping up with competitors?
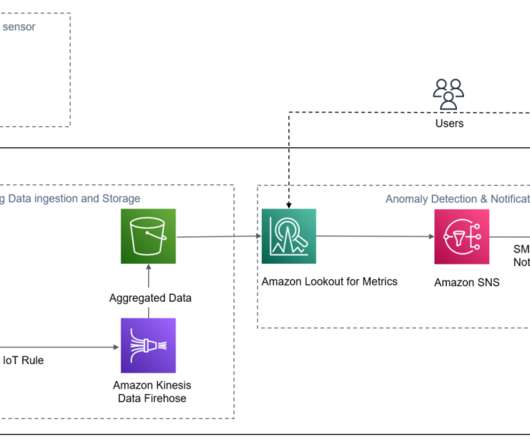
This post shows you how to use an integrated solution with Amazon Lookout for Metrics to break these barriers by quickly and easily detecting anomalies in the key performance indicators (KPIs) of your interest. Lookout for Metrics automatically detects and diagnoses anomalies (outliers from the norm) in business and operational data.
Before developing a customer experience strategy, you need to identify the metrics against which you will measure your performance. Criteria like your company’s Net Promoter Score (NPS) or Customer Satisfaction Score (CSAT) will give you a fair idea of what customers’ opinions are like.
Before developing a customer experience strategy, you need to identify the metrics against which you will measure your performance. Criteria like your company’s Net Promoter Score (NPS) or Customer Satisfaction Score (CSAT) will give you a fair idea of what customers’ opinions are like.
Here’s the executive summary: Net Promoter ® Score (NPS ® ) is a popular metric that companies use to analyze their customer experience efforts, but how does it actually relate to loyalty? Download report for $295. Download report for $295. The bottom line: Promoters are much more valuable than detractors.
This post shows you how to use an integrated solution with Amazon Lookout for Metrics and Amazon Kinesis Data Firehose to break these barriers by quickly and easily ingesting streaming data, and subsequently detecting anomalies in the key performance indicators of your interest. You don’t need ML experience to use Lookout for Metrics.
Read on for the key takeaways from the 2021 live chat benchmark report, then download the full report below for free with access to hundreds of data points, including the trends from 2020 and predictions for 2021. Free Download: Live Chat Benchmark Report 2021. Download Now. Free Download: Live Chat Benchmark Report 2021.
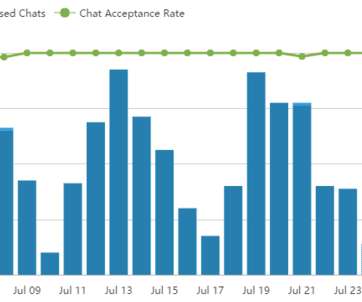
Here are a few things to look for when studying this metric: • How many chats are agents accepting as opposed to rejecting or passing to other agents? Increasingly, FCR is being recognized as one of the most (if not the most) important metrics to watch in customer service. Download Now. Number of chats. Customer satisfaction.
We organize all of the trending information in your field so you don't have to. Join 97,000+ users and stay up to date on the latest articles your peers are reading.
You know about us, now we want to get to know you!
Let's personalize your content
Let's get even more personalized
We recognize your account from another site in our network, please click 'Send Email' below to continue with verifying your account and setting a password.


Let's personalize your content