This site uses cookies to improve your experience. To help us insure we adhere to various privacy regulations, please select your country/region of residence. If you do not select a country, we will assume you are from the United States. Select your Cookie Settings or view our Privacy Policy and Terms of Use.
Cookie Settings
Cookies and similar technologies are used on this website for proper function of the website, for tracking performance analytics and for marketing purposes. We and some of our third-party providers may use cookie data for various purposes. Please review the cookie settings below and choose your preference.
Used for the proper function of the website
Used for monitoring website traffic and interactions
Cookie Settings
Cookies and similar technologies are used on this website for proper function of the website, for tracking performance analytics and for marketing purposes. We and some of our third-party providers may use cookie data for various purposes. Please review the cookie settings below and choose your preference.
Strictly Necessary: Used for the proper function of the website
Performance/Analytics: Used for monitoring website traffic and interactions
According to The State of the Customer Experience survey that we did earlier in 2018, all companies track customer experience using one or several of the 6 world-wide recognised KPIs: Net Promoter Score (NPS), Customer Satisfaction (CSAT), Churn rate, Retention rate, Customer Lifetime Value (CLV) or Customer Effort Score (CES). Why use CSAT?
The question is, how can you measure it? The Net Promoter Score (or NPS) was designed by Fred Reichheld in 2003 to measure loyalty. Soon after, NPS gained popularity and used to be implemented everywhere: from customer service interaction to every individual customer touchpoint. The Net Promoter: what is it?
Lumoa's State of Customer Experience in 2018 revealed that 65% of companies measure the Net Promoter Score (NPS). That made NPS the most widely used metric both B2B and B2C. Discover the recent benchmarks, case-studies and tips dedicated to help you launch a successful NPS strategy. You're about to find out.
Lumoa's State of Customer Experience in 2018 revealed that 65% of companies measure the Net Promoter Score (NPS). That made NPS the most widely used metric both B2B and B2C. Discover the recent benchmarks, case-studies and tips dedicated to help you launch a successful NPS strategy. You're about to find out.
NPS, CSAT , and CES have historically been the main tools every program utilizes to have a systematic way of establishing a voice of customer (VoC) source and leveraging those findings to improve customer experiences. Check out this infographic! Usually, executives just want answers to the questions, “what’s driving NPS?”
It’s the Net Promoter Score (NPS). NPS offers a lens to segment your audience into three groups: the loyal Promoters, the on-the-fence Passives, and the critical Detractors. But why all the buzz around NPS? So, buckle up as we start our journey toward understanding the anatomy of the customer through NPS.
Not only do we share our own NPS on a weekly basis at our company meetings, but we find avenues (such as here in our blog) to write further about it. . RELATED : Check out our most recent infographic to learn more about the 2017 NPS Leaders by Industry.]. MF: Can you change the number of options in the NPS question? .
Believe it or not, you can impact net promotor score (NPS) more with certain channels. Look at your customer journey created in step 1, identify which channels your customers prefer, and then review the NICE inContact CX Transformation Benchmark (<link to infographic?>) What tools do they need? What information?
In our eBook, The Definitive Guide to Monetized Net Promoter®, and our most recent infographic, we outlined the four steps to mastering the Monetized Net Promoter methodology. It takes the Measure and Act cornerstones of NPS®, and builds on them to Monetize and Grow.
In fact, most uses of NPS® nowadays directly refer to NPS2. When NPS started being used, the online environment – especially social media – was nowhere close to reaching its full potential. NPS vs NPS2 – What is the Difference? Also, the elements that are used as metrics in the NPS methodology have changed too.
If some strategies need an explanation, illustrate them in a process infographic like the one. Track and Measure Key Customer Service KPIs. Try using NPS (Net Promoter Score) and CSAT (Customer Satisfaction Score). NPS is a customer satisfaction metric that can help you evaluate the quality of your service.
Whether your organization is a practitioner of Net Promoter Score (NPS) or some other method of determining customer loyalty and customer advocacy, it’s clear that promoters or loyal customers are critical to the long-term sustainability of the organization and typically result in lower costs to operations. Category-leading brand.
Every Apple outlet measures its NPS surveys with each customer walking into the store and then review each customers rating. The post Customer Experience: The Golden Ticket to The Billion Dollar Club [INFOGRAPHIC] appeared first on ProProfs Learning.
Get eye-catching infographics and templates to communicate ideas effectively. Build skills that lead to measurable outcomes—whether it’s nailing a presentation, impressing your team, or leveling up your career. Pick Metrics That Actually Matter Forget about NPS and CSAT. Here’s how you do it: 1.
This small case study shows that when companies move beyond the traditional customer satisfaction metric and rigorously measureNPS , they can find ways to make customers happier, which, in turn, can lead to increased revenue. Yet most businesses struggle to move beyond measuring their NPS.
What is an NPS detractor, and why they are helpful for your business? First, what does NPS stand for? Well, Net Promoter Score (NPS) is a measure of customer satisfaction that helps businesses evaluate their relationship with customers. In fact, thanks to their detractors, they were able to boost their NPS scores by 50%.
One way to do this is by using Net Promoter Score (NPS), a simple and widely used metric that helps businesses measure customer satisfaction, benchmark their performance against competitors, and identify areas for improvement. So let’s dive in and learn more about how NPS can help your business thrive! What is NPS?
Does NPS generate revenue? Let’s take a look at these stats that proves NPS can have a very positive effect on your companies ROI: Companies that have adopted NPS grow twice as fast as their competitors. An average NPS increase of 7% correlates on average with a 1% growth in revenue. Bain & Company ).
Does NPS generate revenue? Let’s take a look at these stats that proves NPS can have a very positive effect on your companies ROI: Companies that have adopted NPS grow twice as fast as their competitors. An average NPS increase of 7% correlates on average with a 1% growth in revenue. Bain & Company ).
Infographics. Net Promoter Score – measures customer loyalty. Answers to the NPS questions are scored on a 0-10 scale, and NPS ranges from -100 to +100. Answers to the NPS questions are scored on a 0-10 scale, and NPS ranges from -100 to +100. Blog articles. To check personal preferences.
What Is Net Promoter Score (NPS®)? The Net Promoter Score, or NPS®, enables organizations to get a clear vision of the health of their customers’ loyalty. Why is NPS® Important? How Does Net Promoter Score (NPS®) Work? How to Calculate the Net Promoter Score (NPS®)?
Net Promoter Score (NPS). There are a number of ways to measure churn: MRR & ARR by dollar amount. It typically involves interviewing customers and looking at your NPS scores and strategy. Consider your NPS score your barometer of customer sentiment. For now let’s concentrate on the following four main metrics.
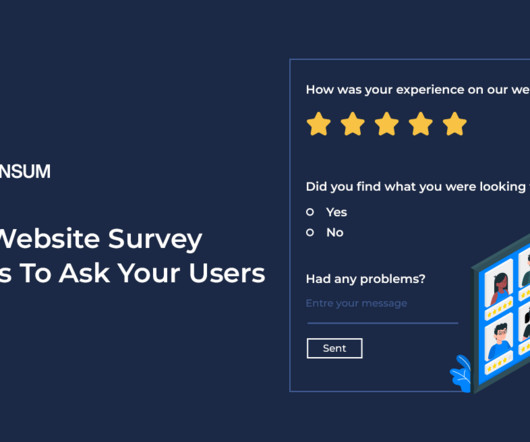
The Importance of Customer Feedback Questionnaires Customer feedback surveys, also referred to as customer surveys, are not only a means of measuring satisfaction levels but also an opportunity to look into your customers’ thoughts and experiences with your brand.
Collecting customer feedback comes with many benefits like improving your products or services, retaining your existing customers, measuring customer satisfaction, and more. (a) b) Measure Customer Satisfaction. You can easily understand your customer loyalty by conducting regular Net Promoter Score (NPS) surveys.
As for what types of surveys you can use, here are your options: NPS (Net Promoter Score). NPS is a type of survey that lets you track growth indicators which show how loyal your customers are, how likely they are to refer your brand to others, and how happy they are with your products and services. NPS Survey Template.
This is what the famous NPS attempts to measure. This could be done through blogs, webinars, infographics, or any other type of content that provides value and educates your customers. For example, if a customer has a positive emotional connection with a brand, they are more likely to overlook minor issues or price increases.
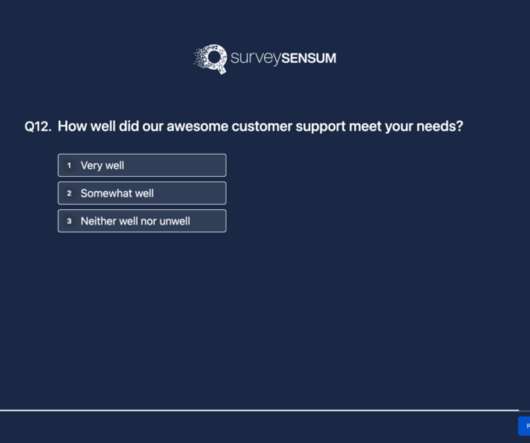
Website Satisfaction Survey Questions What Is It : CSAT surveys are used to measure customer’s overall satisfaction with your product, service, or overall brand. Why It Matters : NPS surveys are a powerful indicator of customer loyalty. images, videos, infographics)? What could we do to improve your experience on our website?
Use charts, graphs, and infographics to make complex data more digestible. Key Metrics used in VOC Analysis Here are some key metrics commonly used in voice of the customer analytics: Customer Satisfaction Score (CSAT) CSAT measures the level of satisfaction customers have with a specific product, service, or experience.
Without measuring metrics, it will be impossible to evaluate your relevance. GA measures your website traffic, gives you insights on your audience, mobile responsiveness, load time, etc. Each metric that GA shows you will make your product better if you measure them and act upon it. from scratch. They provide 1-1 consultations.
STEP 2: Then, it identifies areas of improvement from all the trending tags and prioritizes them based on negative sentiment, maximum frequency, and low NPS score. How to analyze your NPS verbatim? The most common methods of visual presentation are using graphs/charts, tables or infographics.
Venngage, an online platform for creating stunning infographics, is an excellent example of personalizing user experiences. Think about it in this way: The reason why the users signed up for Venngage is that they wanted to create stunning infographics. Net-Promoter Score (NPS). Net-Promoter Score (NPS). No, there isn’t.
Analyze and Measure Your Churn. To put it bluntly, you can’t improve what you don’t measure. Always create and distribute informative content like tutorials, infographics to highlight the value and usage of products. Act on the feedback gathered and take actionable measures to make necessary changes. Let’s dive in!
Evergage’s 2020 Trends in Personalization says the overwhelming majority of marketers (97%) report a measurable lift from their personalization efforts, up 7 percentage points from last year. You could include infographics or video tutorials to make it interesting. Measure customer satisfaction and loyalty. Download yours now.
Once, the issue has been rectified, you can float an NPS survey to measure customer loyalty. You can use an NPS Survey to measure the likelihood of your customers promoting your business to others. Kissmetrics shared an infographic that displayed the lifetime value of a Starbucks customer.
0h, yes, you can create one from your formulas) Visualization: The entered information can be shown in charts, infographics, or graphs. On-Time In-full, is a supply chain metric that measures a supplier’s reliability. Templates: You can directly create and design spreadsheets from the pre-designed templates. (0h,
Understand the Measurement Scales. So let’s take a look at the measurement scales used in surveys. Take your NPS results, for example. Say you run quarterly NPS surveys. Infographics: If you want to present your data in an easy to consume manner for your customers, infographics are your best option.
We shared these insights in our infographic below: Are these challenges still relevant today? Here’s an infographic on the several other benefits of CJM: Source: Perficient.com. Measuring and improving the customer experience from marketing to customer service. Ultimately, what gets measured gets improved!
What measurement scale should I use? Metrics are simply a line in the sand against which you can measure your improvements. Net Promoter Score (NPS). We’ve prepared this VoC Metrics Guide infographic to help you understand the options. Choosing the right metrics can be a big challenge. Available Metrics.
Understand the Measurement Scales. So let’s take a look at the measurement scales used in surveys. Take your NPS results, for example. Say you run quarterly NPS surveys. Infographics: If you want to present your data in an easy to consume manner for your customers, infographics are your best option.
Certainly that’s the case if the outcome will be greater ROI from the department, and an increase in my brand’s NPS score. This information is easy to collect, and practically useless as a measure of the program’s performance. Click here to expand the infographic. Demand performance-based KPIs. That is no longer sustainable.
And you also know that if a small investment of your time can produce greater ROI from any department, and raise your NPS score significantly, then that’s time well spent. Click here to expand the infographic. How many times have you said, as CEO, that ‘we can’t manage what we can’t measure’ or ‘we must become more data-driven’?
We organize all of the trending information in your field so you don't have to. Join 97,000+ users and stay up to date on the latest articles your peers are reading.
You know about us, now we want to get to know you!
Let's personalize your content
Let's get even more personalized
We recognize your account from another site in our network, please click 'Send Email' below to continue with verifying your account and setting a password.


Let's personalize your content