This site uses cookies to improve your experience. To help us insure we adhere to various privacy regulations, please select your country/region of residence. If you do not select a country, we will assume you are from the United States. Select your Cookie Settings or view our Privacy Policy and Terms of Use.
Cookie Settings
Cookies and similar technologies are used on this website for proper function of the website, for tracking performance analytics and for marketing purposes. We and some of our third-party providers may use cookie data for various purposes. Please review the cookie settings below and choose your preference.
Used for the proper function of the website
Used for monitoring website traffic and interactions
Cookie Settings
Cookies and similar technologies are used on this website for proper function of the website, for tracking performance analytics and for marketing purposes. We and some of our third-party providers may use cookie data for various purposes. Please review the cookie settings below and choose your preference.
Strictly Necessary: Used for the proper function of the website
Performance/Analytics: Used for monitoring website traffic and interactions
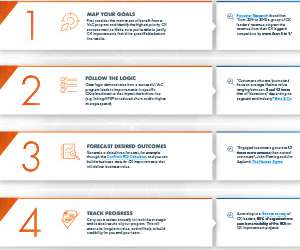
As an organization’s customer experience efforts mature, CX metrics become a critical guidepost for all of its activities. You can see different ways to download this infographic below. Here are links to download different versions of the infographic: Infographic: in .png png format, in .pdf pdf format 18?
You can download (and print) this infographic in different forms: Infographic: infographic in pdf, infographic in png Poster (12″ x […]. Here’s some interesting data snippets from the recent report, State of VoC Programs, 2016. For additional info, check out our VoC resource page.
You can download (and print) this infographic in different forms: Infographic: infographic in pdf, infographic in png Poster (12″ x 24″): poster in pdf, poster in png Filed under: […]. Voice of the Customer (VoC) programs are a central part of most customer experience efforts.
We’re always looking for ways to share interesting data and concepts, so we regularly publish parts of our content in infographics. In case you’ve missed any of them, here’s a collage of the infographics that we’ve already published this year.
Customer experience (CX) metrics are a CX program’s bread and butter. But it’s not easy—a CX metric score alone can’t create transformation. CX metrics aren’t one-size-fits-all. CX metrics aren’t one-size-fits-all. How are the metrics of field services, retail, call-center, first-contact resolution, etc.
Sure, it’s great to see a boost in CX metrics like NPS , CSAT , and CES , but what really drives impact? Creating tangible value for your business—and that means proving that sometimes elusive CX ROI. Four Ways to Prove CX ROI (and Assets That Show You How). Look no further! Let’s dive in!
Get eye-catching infographics and templates to communicate ideas effectively. Show Me the Money: Proving ROI from Your CX Initiatives You know the drill. Someone in leadership leans in, raises an eyebrow, and hits you with the classic: “What’s the ROI of this?” Why is ROI So Hard to Prove?
Fortunately, as far as live chat reporting is concerned, Velaro has released an infographic that includes stats such as: average time waiting in the queue for live chat, average total chat time, and. The post Common Live Chat Reporting Metrics: How Do You Rank? the busiest hour(s) of the day for live chat. appeared first on Velaro.
It’s well known that a VoC program can have a measurable financial impact on your business by enabling improvements in key metrics such as customer churn, customer spend, and cost of service. Beyond this, making an ROI-based business case can appear daunting, as it involves a certain amount of work up front.
It’s been shown that live chat can drive 3x – 5x more conversions and deliver up to 6000% ROI. Recommended for you: Millennials Prefer Live Chat for Speed and Convenience [Infographic]. Studies have shown time and time again that live chat helps to increase sales – and companies are reaping the benefits.
The Preferred Channel by Customers, Exceptional ROI for Companies. It still uses live agents, queues interactions, and has many comparable metrics. Outstanding ROI for Companies. It’s easy to see that live chat provides an outstanding return on investment (ROI) for companies. The good news is that it is great for both.
” It opens, somewhat ominously, this way: Customer Experience (CX) specialist, and TribeCX CEO David Hicks, recently noted that the statistics in an infographic about survival rates in airplane crashes were almost identical to the rate of job retention for CX practitioners. Build proof-points to show ROI from CX.
” It opens, somewhat ominously, this way: Customer Experience (CX) specialist, and TribeCX CEO David Hicks, recently noted that the statistics in an infographic about survival rates in airplane crashes were almost identical to the rate of job retention for CX practitioners. Build proof-points to show ROI from CX.
We shared these insights in our infographic below: Are these challenges still relevant today? Referring to the CX Network research cited above, it confirms that building a customer-first culture, linking CX initiatives to ROI, and understanding the customer are the top three challenges faced by companies in 2017.
Track and Measure Results Use analytics tools to track the performance of your local content marketing efforts, including website traffic, engagement metrics, and conversions. This will also encourage from the google local guide program to interact with your business. What is the Difference Between SEO and Local SEO?
This small case study shows that when companies move beyond the traditional customer satisfaction metric and rigorously measure NPS , they can find ways to make customers happier, which, in turn, can lead to increased revenue. This could be in the form of social media posts, blog articles, videos, or infographics.
Many businesses have grown and seen better ROI thanks to Facebook’s precise targeting capabilities. Within “Engagement,” the common goals or metrics for Facebook boosted posts are: Post engagement: You can choose this goal/metric for content with image or text. But when should you opt for a boost post over an ad?
Usually, that’s about 8 or 10 metrics at the most. For those types of scores, I’ve heard executives having anywhere between 8 to 20 different metrics. If you do have a lot, you want to group them by sub-metrics (e.g., You want to create a metric that you can always rely on. You can show ROI really quickly.
Managers need to be able to interpret data from social media metrics such as impressions, reach, clicks, and engagement to amplify or adjust campaigns. Using high-quality visuals like infographics, videos, and photos stands out more on a newsfeed and can grab users’ attention faster. Choosing the right metrics.
Are branded communities living up to organizational expectations? Although hopes are high, B2B online communities frequently become nothing more than dead zones featuring the occasional support question—a far cry from their vibrant consumer counterparts. However, all that is changing.
Create SEO optimized blog articles, social media posts, infographics, and videos. Email marketing has an ROI of $36 for every $1 spent. Track performance metrics: Measure KPIs, including website traffic, conversions, customer sentiment , and other metrics.
This enables businesses to optimize their efforts and achieve a better return on investment (ROI) compared to traditional marketing methods. Messaging: B2B messaging highlights factors like cost-effectiveness, ROI, and problem-solving, while B2C messaging focuses on personal benefits like time-saving and lifestyle appeal.
For example, money spent on marketing progr ams results in leads, or spent on content results in tangible items like presentations, videos, infographics and white papers – which in turn can be used to generate more leads. What is the ROI? How does this make us more innovative, competitive, and cost-effective?
For the full survey results, download our INFOGRAPHIC. Contrarily, only 1% of companies only maintain customer health to benchmark against a best in class customer and overall ROI. Customer Health Score is an essential metric for all businesses. Who Is Using a Customer Health Score? Defining the Customer Health Score.
This clear and concise infographic is based on one of the most comprehensive global surveys of over 700 CX practitioners worldwide and was carried out by Confirmit in partnership with Engage Business Media. Even among Leaders, less than half of our audience feel they can confidently point to Return on Investment (ROI) figures.
Let’s take a look at these stats that proves NPS can have a very positive effect on your companies ROI: Companies that have adopted NPS grow twice as fast as their competitors. The ROI of NPS is undeniable and is an integral part of gauging your customer’s satisfaction with your company. Bain & Company ).
Let’s take a look at these stats that proves NPS can have a very positive effect on your companies ROI: Companies that have adopted NPS grow twice as fast as their competitors. The ROI of NPS is undeniable and is an integral part of gauging your customer’s satisfaction with your company. Bain & Company ).
Learn how to add bullet points, add additional images, present insightful infographics, add subheadings, reduce fluff, break up paragraphs, and so on. Only when you know who exactly to target, would your PPC campaigns have high ROIs. Measure the metrics. The ROI of email marketing is ridiculously high. 6 Email marketing.
Most likely, you check up on your basic online store metrics frequently. Among others, ROI is the essential factor to focus on while evaluating your overall performance. In fact, building better relationships with your clients actively contributes to improving ROI. Have a look at the screenshot from KISSmetrics infographics.
Deeper metrics – Though comparing likes, mentions and retweets might make you think you’re winning (or losing), you really don’t have all the facts if you stop at superficial metrics. SOCIAL MEDIA METRIC TRACKERS. SOCIAL MEDIA METRICS TRACKERS. Activity metrics. Engagement metrics. Audience metrics.
Social Sentiment is the most important metric available to brands. How to Measure Social Analytics ROI. Social Media Metrics You Need to Master: Get More from Your Analytics. Analyzing Social Trends as The NFL Season Starts [INFOGRAPHIC]. That’s where Sentiment Analysis comes in. RELATED ARTICLES.
For example, money spent on marketing programs results in leads, or spent on content results in tangible items like presentations, videos, infographics and white papers – which can then in turn be used to generate more leads. Those with obvious measurable results attributed to single department.
This could include articles, videos, infographics, industry news, or company updates. Track & analyse Monitor your page analytics: Utilize LinkedIn’s built-in analytics to track your page’s performance, including follower growth, engagement metrics, and website traffic.
5 Valuable Insights to Spotlight Customer Growth [Infographic]. The ROI of Customer Success Software. 5th Annual SaaS Metrics Report. McKinsey & Co. recently ran an analysis looking at the biggest predictors of growth for $100 million companies that turned into $1 billion companies. But how much can you expect to earn?
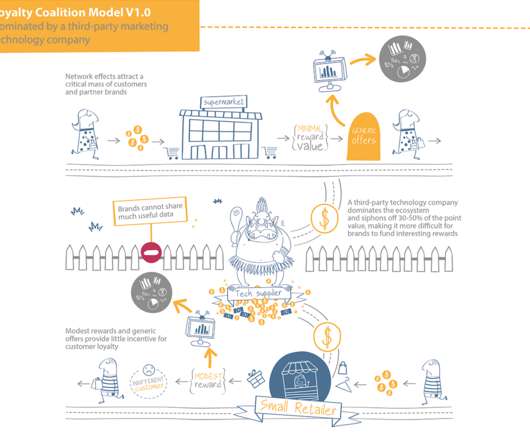
I’m not going to quote a bunch of statistics, but if loyalty programs did not generate positive ROI, thousands of top brands would have given up on them decades ago. And you also know that if a small investment of your time can produce greater ROI from any department, and raise your NPS score significantly, then that’s time well spent.
Certainly that’s the case if the outcome will be greater ROI from the department, and an increase in my brand’s NPS score. Click here to expand the infographic. Depending on how this information is presented, it may only represent vanity metrics. A minority of teams are brilliant, but the majority have only executed ‘OK’.
They Preach the ROI of CX. They know that if you can grasp the drivers of customer loyalty, understand what operational parts of the business affect those drivers, and then measure the business based on those operational metrics, you will be successful. We don’t use either of those metrics.
Th-eir work was published in a paper titled- “ E-Metrics, Business Metrics for the New Economy “ In their customer lifecycle analysis, Jim and Matt stated that Customer Life Cycle starts when you reach your target market and progresses until a loyal customer base is established.
Make infographics that incorporate key ideas, points, statistics, etc. The objective should be to maximize your ROI from the customer. Metrics like customer lifetime value (CLV) tells you how much business your customer brings over the course of their association with you. Create how-to and educational videos.
One way to do this is by using Net Promoter Score (NPS), a simple and widely used metric that helps businesses measure customer satisfaction, benchmark their performance against competitors, and identify areas for improvement. As you can see from the given infographic, the average NPS score in online (retail) shopping is 41.
User engagement Engagement metrics: The algorithm considers how users interact with hashtagged content, including likes, shares, comments, and the time spent viewing it. To get the best ROI in terms of effort and time, you must use hashtags to provide value. How to connect with your audience through hashtags?
An infographic maker that turns data into visually stimulating content. Call Tracking Metrics. Content Research Scheduling tools Writing tools Asset Production tools (design, infographics) Video Production tools Reviews are effective user generated content. Pricing: Free (iOS only). Pricing: $0 - $4 per mo. Pricing: $29 - $149.
Some critical components of a social media marketing plan are : Goals and objectives Target audience analysis Social media channel selection Content strategy Posting schedule and frequency Metrics and measurement Here’s your step-by-step guide to creating a social media marketing plan. It is an important component in social media management.
We organize all of the trending information in your field so you don't have to. Join 97,000+ users and stay up to date on the latest articles your peers are reading.
You know about us, now we want to get to know you!
Let's personalize your content
Let's get even more personalized
We recognize your account from another site in our network, please click 'Send Email' below to continue with verifying your account and setting a password.


Let's personalize your content