This site uses cookies to improve your experience. To help us insure we adhere to various privacy regulations, please select your country/region of residence. If you do not select a country, we will assume you are from the United States. Select your Cookie Settings or view our Privacy Policy and Terms of Use.
Cookie Settings
Cookies and similar technologies are used on this website for proper function of the website, for tracking performance analytics and for marketing purposes. We and some of our third-party providers may use cookie data for various purposes. Please review the cookie settings below and choose your preference.
Used for the proper function of the website
Used for monitoring website traffic and interactions
Cookie Settings
Cookies and similar technologies are used on this website for proper function of the website, for tracking performance analytics and for marketing purposes. We and some of our third-party providers may use cookie data for various purposes. Please review the cookie settings below and choose your preference.
Strictly Necessary: Used for the proper function of the website
Performance/Analytics: Used for monitoring website traffic and interactions
It’s hard to keep up with everything that Temkin Group published in 2017, so we put together a couple of infographics to highlight some of the key data insights. This first infographic looks at CX efforts and the ROI of those activities. Here are links to download different versions of the infographic: Infographic: in .jpg
In honor of Customer Experience Day, Temkin Group created its second annual “The State of Customer Experience” infographic. You can see a vertical infographic below or: Click here to download the vertical infographic (.pdf). Here’s a link to last year’s infographic.
You can see different ways to download this infographic below. Here are links to download different versions of the infographic: Infographic: in .png pdf format Here are links to the research referenced in the infographic: Five Steps For Building A Strong CX Metrics Program The State of CX Metrics, 2017. png format, in .pdf
Once again, Temkin Group is publishing a new infographic as part of our CX Day celebration. Take a look at last year’s ultimate CX infographic. Here are links to download different versions of the infographic: Infographic: in .jpg jpg format, in .pdf pdf format 18? poster: in .jpg jpg format, in .pdf pdf format.
If you like customer experience and visualizations, then you should enjoy this collection of CX infographics that we’ve published over the last year or so. Each of the infographics can be downloaded as a traditional infographic, or in the form of an 18″ x 24″ poster.
You can download (and print) this infographic in different forms: Infographic: infographic in pdf, infographic in png Poster (12″ x […]. Here’s some interesting data snippets from the recent report, State of VoC Programs, 2016. For additional info, check out our VoC resource page.
You can download (and print) this infographic in different forms: Infographic: infographic in pdf, infographic in png Poster (12″ x 24″): poster in pdf, poster in png Filed under: […]. Voice of the Customer (VoC) programs are a central part of most customer experience efforts.
It’s hard to keep up with everything that Temkin Group published in 2017, so we put together a couple of infographics to highlight some of the key data insights. The initial infographic examined CX efforts and ROI. In this infographic, we examine 12 factoids on CX ratings, people, and leadership. jpg format, in .pdf
In this infographic, we share data from the Temkin Group research report, ROI of Customer Experience 2015. You can download (and print) this infographic in different forms: Infographic : infographic in pdf , infographic in png. Filed under: Customer experience , Infographic , ROI of Customer Experience.
We’re always looking for ways to share interesting data and concepts, so we regularly publish parts of our content in infographics. In case you’ve missed any of them, here’s a collage of the infographics that we’ve already published this year.
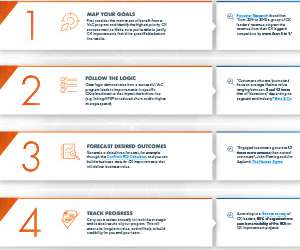
Creating tangible value for your business—and that means proving that sometimes elusive CX ROI. Four Ways to Prove CX ROI (and Assets That Show You How). For example, America’s largest cable and home internet provider leverages VoC technology in their regional customer care centers (and are able to prove millions in CX ROI).
How to prove the ROI of your efforts. Infographic: Voice of the Customer Program. GetFeedback's Voice of the Customer Program Infographic Copy to Clipboard. The post [Infographic] How to Run a Voice of the Customer Program appeared first on GetFeedback Blog. How to take action with your customer feedback.
Infographic: The Six Laws of Customer Experience. Report: ROI of Customer Experience, 2014. The Ultimate Customer Experience Infographic, 2014. Free eBook: The 6 Laws Of Customer Experience (2008). LEGO’s Building Block For Good Experiences (2009). Net Promoter Score and Market Share For 60 Tech Vendors (2012).
Top 10 Marketing Infographics to Smash 2018 (Inspiration for the Visual World). These are the most shared marketing infographics of 2017. What was new for last year is that many marketing infographics that were shared were actually about content marketing. Your brand is not what you think it is!
With email being so instantaneous, and the potential ROI needed quickly, companies usually rely on an email campaign to grab their reader’s attention. Or, as many companies see it, Q4 of their fiscal year. A time when companies seek revenue in a distracted and turned-off B2B world as a last-ditch effort for profit margins.
Once again, Temkin Group is publishing a new infographic for CX Day. You can see the full infographic below. Here are links to: Download a printable infographic (.pdf). Download a printable 18″ x 24″ poster (.pdf).
Get eye-catching infographics and templates to communicate ideas effectively. Show Me the Money: Proving ROI from Your CX Initiatives You know the drill. Someone in leadership leans in, raises an eyebrow, and hits you with the classic: “What’s the ROI of this?” Why is ROI So Hard to Prove?
Take a look at this infographic. You can download (and print) this infographic in different forms: Infographic: infographic in pdf, infographic in png Poster […]. What does that path look like?
You’ve developed graphics, infographics, and maybe even some videos to go along with your written content. You’ve got to determine your content marketing return on investment (ROI). You’ve written a ton of educational and engaging blogs, white papers, case studies, and more. How can you tell if they’re worth the costs?
In this process, demonstrating ROI is the holy grail for CX practitioners, and a Gartner survey of CX leaders showed that 50% of organizations now have visibility of the ROI generated by CX improvement projects. Beyond this, making an ROI-based business case can appear daunting, as it involves a certain amount of work up front.
Check out this infographic! If you’re looking for more resources and insight into CX metrics and ensuring your CX program delivers business value (ROI) to your organization, watch this webinar with third-party analyst firm, Forrester, to learn the answers.
The Ultimate Customer Experience Infographic, 2015. Report: ROI of Customer Experience, 2014 (see updated 2015 version ). 10 Customer Experience Factoids from 2014 (Infographic). Report: 2015 Temkin Experience Ratings. Report: Net Promoter Score Benchmark Study, 2015. 8 CX Trends for 2015 (The Year of the Employee).
This graphic from the report “ The ROI of Customer Experience, 2014 ” shows the connection between CX and loyalty. This “ Ultimate CX Infographic ” also provides some of the compelling economics of CX: How Do Organizations Affect CX? Why Should You Care About CX? How Do You Build A Customer-Centric Culture?
Calculator: Live Chat ROI Calculator. At first, we were surprised at how popular this interactive live chat ROI calculator is, given how many organizations already use live chat. Our chatbot ROI calculator is handy too!). Infographic: How to choose the best kind of chatbot for your business.
The Preferred Channel by Customers, Exceptional ROI for Companies. Outstanding ROI for Companies. It’s easy to see that live chat provides an outstanding return on investment (ROI) for companies. Check out our infographic: The Value of Chat: The Preferred Channel by Customers, Exceptional ROI for Companies.
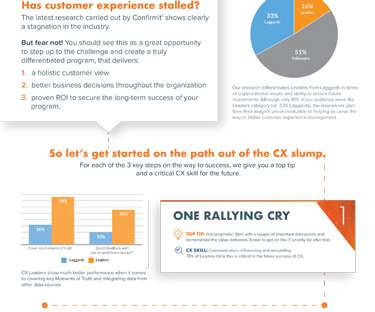
Confirmit has helped businesses like yours achieve more than 300% ROI from their VoC program. Check out this infographic to learn how you can tailor your Voice of the Customer to your unique business needs. If you want to secure a significant return on investment from your VoC program, you need to tailor it to your business.
This infographic summarizes the latest research carried out by Confirmit, which shows a clear stagnation in the industry. proven ROI to secure the long-term success of your program. proven ROI to secure the long-term success of your program. This infographic shows you how to get started on the path out of the CX slump.
It’s been shown that live chat can drive 3x – 5x more conversions and deliver up to 6000% ROI. Recommended for you: Millennials Prefer Live Chat for Speed and Convenience [Infographic]. Studies have shown time and time again that live chat helps to increase sales – and companies are reaping the benefits.
Unlike other mobilized field service solutions, Frost & Sullivan found Astea’s Alliance Mobile Edge to be a competitive value with proven ROI. Download Infographic. See how Mobile Edge enables a true win-win by satisfying the business needs of service organizations and the demands of their connected customers.
Adding value to a company also increases the ROI of its marketing investments. You can see the full Infographic overview below; click on it to see the full-sized original. Therefore strong loyalty is a valuable benefit for a brand. Luckily, what’s good for the customer is good for business.
Fortunately, as far as live chat reporting is concerned, Velaro has released an infographic that includes stats such as: average time waiting in the queue for live chat, average total chat time, and. That said, every organization that receives that guidance is still left hungry for a sense of what “normal” or “average” might be.
Here’s a revealing infographic from an AOL and Oliver Wyman research study, which explores the motivations, influences, and behaviors of consumers who recently switched banks and opened a new primary checking account. It’s a low-cost, high-ROI banking customer acquisition strategy.
Download the infographic or TSIA report to learn how to embrace all the field service trends including: How to evolve from response-time contracts to resolution-time service contracts. What innovative service offering can help your clients get higher ROI on equipment. Get Infographic and Report.
With 2019 right around the corner, we put together a list of the top 3 webinars, infographics, whitepapers and videos from 2018. ” ROI of IoT: Organizations continue to struggle with getting their customers to connect, but IoT can help. We hope you enjoy them.
It then takes that topic and relates it to its products through an infographic that explains how to skin a dear with an air compressor. The infographic works equally well for a website or in an email. Test a variety of campaigns and figure out which ones have the best return on investment (ROI). Plan a Social Media Strategy.
We shared these insights in our infographic below: Are these challenges still relevant today? Referring to the CX Network research cited above, it confirms that building a customer-first culture, linking CX initiatives to ROI, and understanding the customer are the top three challenges faced by companies in 2017.
Adding value to a company also increases the ROI of its marketing investments. Click to see original infographic. You can see the full Infographic overview above; click on it to see the original. Therefore loyalty is a valuable benefit for a brand. Luckily, what’s good for the customer is good for business.
Self-installation delivers ROI while smoothing the path to IoT adoption. The service has become the focus of many market segments, providing a clear ROI in multiple service categories. More information on this recent survey, as well as a related infographic , can be found here.
I downloaded an infographic [link] this morning from Customer Management Exchange Group that shows the Top 5 Areas of Investment for Marketing Leaders and how investment priorities have changed for strategic marketers over the last 12 months. I am only reacting to the infographic. Basically – I’m shocked!
It then takes that topic and relates it to its products through an infographic that explains how to skin a dear with an air compressor. The infographic works equally well for a website or in an email. Test a variety of campaigns and figure out which ones have the best return on investment (ROI). Plan a Social Media Strategy.
” It opens, somewhat ominously, this way: Customer Experience (CX) specialist, and TribeCX CEO David Hicks, recently noted that the statistics in an infographic about survival rates in airplane crashes were almost identical to the rate of job retention for CX practitioners. Build proof-points to show ROI from CX.
” It opens, somewhat ominously, this way: Customer Experience (CX) specialist, and TribeCX CEO David Hicks, recently noted that the statistics in an infographic about survival rates in airplane crashes were almost identical to the rate of job retention for CX practitioners. Build proof-points to show ROI from CX.
We organize all of the trending information in your field so you don't have to. Join 97,000+ users and stay up to date on the latest articles your peers are reading.
You know about us, now we want to get to know you!
Let's personalize your content
Let's get even more personalized
We recognize your account from another site in our network, please click 'Send Email' below to continue with verifying your account and setting a password.


Let's personalize your content