This site uses cookies to improve your experience. To help us insure we adhere to various privacy regulations, please select your country/region of residence. If you do not select a country, we will assume you are from the United States. Select your Cookie Settings or view our Privacy Policy and Terms of Use.
Cookie Settings
Cookies and similar technologies are used on this website for proper function of the website, for tracking performance analytics and for marketing purposes. We and some of our third-party providers may use cookie data for various purposes. Please review the cookie settings below and choose your preference.
Used for the proper function of the website
Used for monitoring website traffic and interactions
Cookie Settings
Cookies and similar technologies are used on this website for proper function of the website, for tracking performance analytics and for marketing purposes. We and some of our third-party providers may use cookie data for various purposes. Please review the cookie settings below and choose your preference.
Strictly Necessary: Used for the proper function of the website
Performance/Analytics: Used for monitoring website traffic and interactions
In this post, we focus on one such complex workflow: document processing. Rule-based systems or specialized machine learning (ML) models often struggle with the variability of real-world documents, especially when dealing with semi-structured and unstructured data.
What User Feedback Metrics Are Essential for a SaaS Company to Track? Net Promoter Score Churn Rate Customer Lifetime Value Retention Rate Customer Satisfaction Score Free-to-Paid Conversion Rate Customer Effort Score Activation Rate Lead Conversion Rate Customer feedback metrics provide data-driven insight into user activity and engagement.
In the following sections, we explore how to lead a successful CX transformational program in a B2B settingcovering everything from executive leadership and strategy to metrics, culture change, and real-world case studies. Balancing quantitative metrics with qualitative feedback gives a full picture.
In this context , loyalty becomes more than just a metric; it is an indicator of long-term partnership strength. Caterpillars streamlined procurement platform allows clients to track orders, request support, and access product documentation in one place. But what truly drives loyalty in the B2B space?
A survey of 1,000 contact center professionals reveals what it takes to improve agent well-being in a customer-centric era. This report is a must-read for contact center leaders preparing to engage agents and improve customer experience in 2019.
Its a dynamic document that, like your partnership, requires time and attention. Because we didnt know until the waning days of our relationship that our client was being measured by their head office in Europe on one KPI above all others: the scores on their post-contact surveys a metric that didnt even appear in our SOW.
Customer experience (CX) metrics have an important role to play in this strategy—something I explored in-depth in a previous post: Customer Experience in the Era of Product Led Growth. Metrics are essential to understanding progress on the product led growth curve. This is where CX metrics are so valuable.
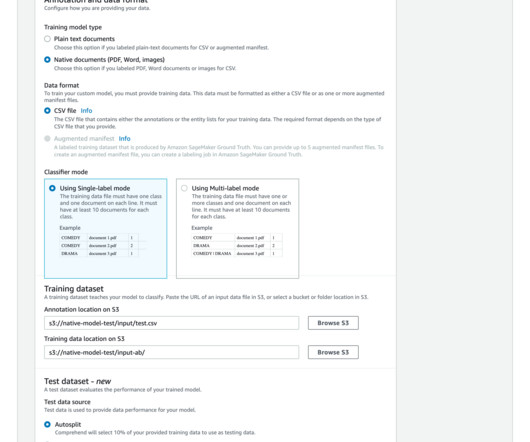
Organizations across industries want to categorize and extract insights from high volumes of documents of different formats. Manually processing these documents to classify and extract information remains expensive, error prone, and difficult to scale. Categorizing documents is an important first step in IDP systems.
For modern companies that deal with enormous volumes of documents such as contracts, invoices, resumes, and reports, efficiently processing and retrieving pertinent data is critical to maintaining a competitive edge. What if there was a way to process documents intelligently and make them searchable in with high accuracy?
Amazon Textract is a machine learning (ML) service that automatically extracts text, handwriting, and data from scanned documents. Queries is a feature that enables you to extract specific pieces of information from varying, complex documents using natural language. personal or cashier’s checks), financial institution and country (e.g.,
This is where intelligent document processing (IDP), coupled with the power of generative AI , emerges as a game-changing solution. The process involves the collection and analysis of extensive documentation, including self-evaluation reports (SERs), supporting evidence, and various media formats from the institutions being reviewed.
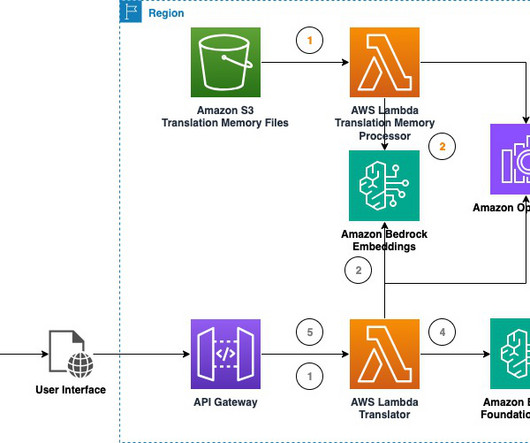
The solution offers two TM retrieval modes for users to choose from: vector and document search. When using the Amazon OpenSearch Service adapter (document search), translation unit groupings are parsed and stored into an index dedicated to the uploaded file. For this post, we use a document store. Choose With Document Store.
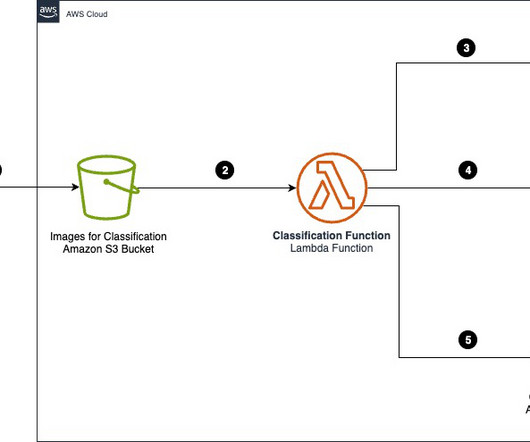
AWS customers in healthcare, financial services, the public sector, and other industries store billions of documents as images or PDFs in Amazon Simple Storage Service (Amazon S3). In this post, we focus on processing a large collection of documents into raw text files and storing them in Amazon S3.
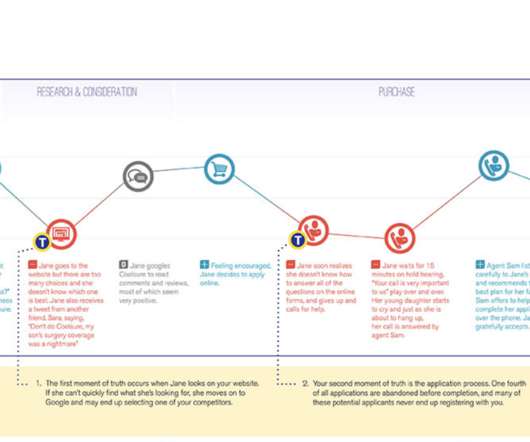
Step 5: Understand Customer Sentiment While customer sentiment is usually a metric reserved for consumers who have already become customers, it can be useful in creating a customer journey map. For example, suppose you discover that consumers didn’t like the email they received after downloading a document from your website.
Current RAG pipelines frequently employ similarity-based metrics such as ROUGE , BLEU , and BERTScore to assess the quality of the generated responses, which is essential for refining and enhancing the models capabilities. More sophisticated metrics are needed to evaluate factual alignment and accuracy.
Research shows that companies leveraging advanced experimentation techniques see significant enhancements in performance metrics, such as a 20% increase in customer satisfaction and higher sales conversion rates. Identify Key Metrics : Determine which performance indicators will measure the success of your experiments.
By documenting the specific model versions, fine-tuning parameters, and prompt engineering techniques employed, teams can better understand the factors contributing to their AI systems performance. Evaluation algorithm Computes evaluation metrics to model outputs. Different algorithms have different metrics to be specified.
Make Documents Mobile-Friendly Customers expect smooth access to important information on their smartphones. Mobile-friendly documents enable this convenience by offering accessible and readable content on customers’ devices. What are the best Customer Experience Metrics for Insurance Companies to Measure?
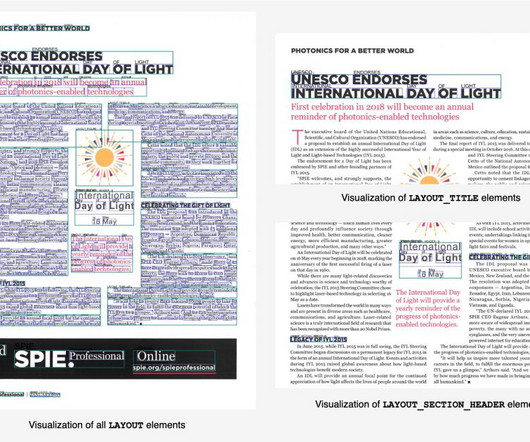
Amazon Textract is a machine learning (ML) service that automatically extracts text, handwriting, and data from any document or image. AnalyzeDocument Layout is a new feature that allows customers to automatically extract layout elements such as paragraphs, titles, subtitles, headers, footers, and more from documents.
One caveat: don’t take this as a model for the only or the right way to document a journey map. Document the customer’s emotional reaction. Here’s some general advice from the e-book How to Use Customer Loyalty Metrics: NPS, CES & CSAT : . Best Metric: CSAT. Best Metric: CSAT. Best Metric: CES or CSAT.
Great CX meetings start with a solid foundation in the form of a CX Charter — a simple document that answers these six questions: What is Our CX Vision? What metric went up? Check In: Review customer feedback and discuss any key customer experience metrics. . So how do you run better CX meetings? Start with a CX Charter.
The ability to effectively handle and process enormous amounts of documents has become essential for enterprises in the modern world. Due to the continuous influx of information that all enterprises deal with, manually classifying documents is no longer a viable option.
Amazon Lookout for Metrics is a fully managed service that uses machine learning (ML) to detect anomalies in virtually any time-series business or operational metrics—such as revenue performance, purchase transactions, and customer acquisition and retention rates—with no ML experience required. To learn more, see the documentation.
Such data often lacks the specialized knowledge contained in internal documents available in modern businesses, which is typically needed to get accurate answers in domains such as pharmaceutical research, financial investigation, and customer support. For example, imagine that you are planning next year’s strategy of an investment company.
This approach allows organizations to assess their AI models effectiveness using pre-defined metrics, making sure that the technology aligns with their specific needs and objectives. referenceResponse (used for specific metrics with ground truth) : This key contains the ground truth or correct response.
Lack of alignment on important metrics. Brand image and brand equity metrics. Besides measuring your chosen metrics, trends often mean more than the numbers themselves – in many markets the numbers will be going up anyway. Step 5: Once the metrics are agreed upon, turn them into a one-page summary or dashboard.
That will allow you to see the correlations of different metrics. . Use quantitative metrics to encourage your company to understand the direct impact that things like customer loyalty and customer experience have on organizational metrics like churn and recurring revenue. Outdated documentation. It makes sense, right? .
Related resource: Customer Experience ROI: Tying CX Investments to Business Success Identifying Signs of a CX Problem You can monitor several CX and operational metrics to understand if you have a CX problem. The first step is to review your metrics and listen to customer feedback regularly.
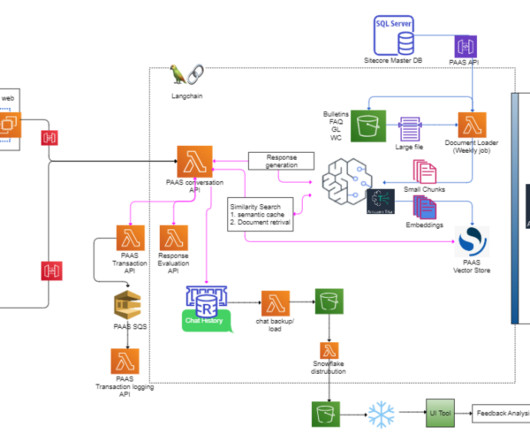
PAAS now includes PAAS AI, the first commercially available interactive generative-AI chats specifically developed for premium audit, which reduces research time and empower users to make informed decisions by answering questions and quickly retrieving and summarizing multiple PAAS documents like class guides, bulletins, rating cards, etc.
Recall@5 is a specific metric used in information retrieval evaluation, including in the BEIR benchmark. decode("utf-8")) response = response["embeddings"]["float"][0] elif is_txt(doc): # Doc is a text file, encode it as a document with open(doc, "r") as fIn: text = fIn.read() print("Encode img desc:", doc, " - Content:", text[0:100]+".")
Benchmarking, in the general sense, is the process of documenting a company’s performance during any given period with the goal of comparing it to another period, often in the future. As you may have deduced already, the survey response rate benchmarking process consists of documenting the performance of your CEM system.
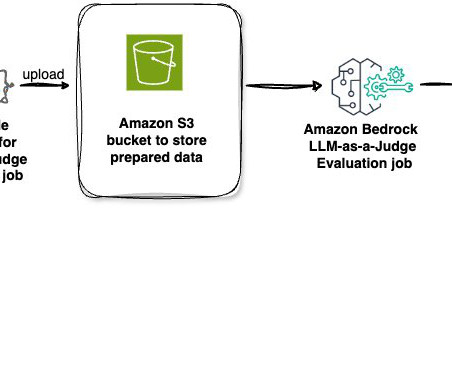
However, selecting the optimal model for a specific use case requires efficiently comparing models based on an organizations preferred quality and responsible AI metrics. You can choose from LLMs hosted on Amazon Bedrock to be the judge, with a variety of quality and responsible AI metrics such as correctness, completeness, and harmfulness.
Get something documented and work to refine it over time. To get a pulse across your entire customer base, consider tracking core CX metrics. Including customer success metrics, particularly success milestones, in customer journey mapping isn’t mentioned or suggested often. Gather Customer Data.
I know it is hard to refuse, but the briefing document should shield market researchers from exactly these situations. As mentioned before, your briefing document is your best ally, this time in preventing political market research projects. Your Market Research briefing document is your best ally.
You can track this by monitoring pre-selected customer experience metrics to identify trends, understand customer preferences, and detect any drop-offs in the automated journey. Monitor and Optimize Continuously track the performance of customer experience automation strategies to refine and improve customer interactions over time.
Although automated metrics are fast and cost-effective, they can only evaluate the correctness of an AI response, without capturing other evaluation dimensions or providing explanations of why an answer is problematic. Human evaluation, although thorough, is time-consuming and expensive at scale.
This post focuses on evaluating and interpreting metrics using FMEval for question answering in a generative AI application. FMEval is a comprehensive evaluation suite from Amazon SageMaker Clarify , providing standardized implementations of metrics to assess quality and responsibility. Question Answer Fact Who is Andrew R.
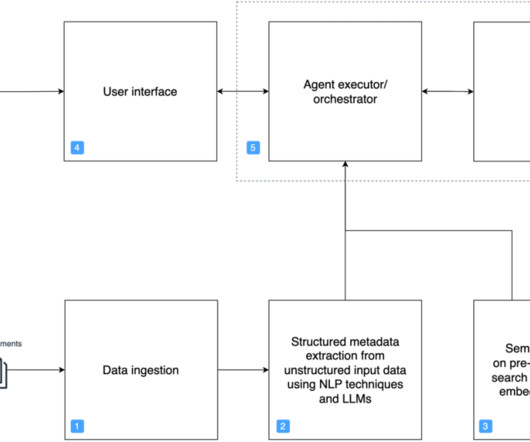
Besides the efficiency in system design, the compound AI system also enables you to optimize complex generative AI systems, using a comprehensive evaluation module based on multiple metrics, benchmarking data, and even judgements from other LLMs. The DSPy lifecycle is presented in the following diagram in seven steps.
Strategies to boost adoption include: Interactive Demos and Documentation: Providing detailed documentation and hands-on training sessions. Increasing Annual Recurring Revenue (ARR) For subscription-based B2B companies, ARR is a critical metric. Strategies include: Analytics Tools: Tracking key metrics to gain insights.
In addition, RAG architecture can lead to potential issues like retrieval collapse , where the retrieval component learns to retrieve the same documents regardless of the input. This makes it difficult to apply standard evaluation metrics like BERTScore ( Zhang et al.
It’s easy to create goals in customer experience that are either: Based on metrics that the customer feedback team held responsible can’t influence, like NPS Or big ideas that aren’t real goals, like “make every customer delighted every time” Every other team has real goals. We got you. Get real about goals.
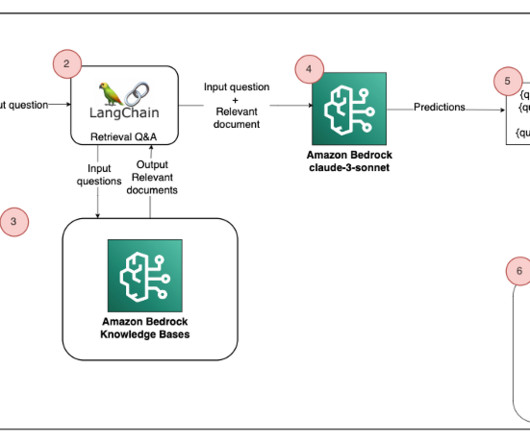
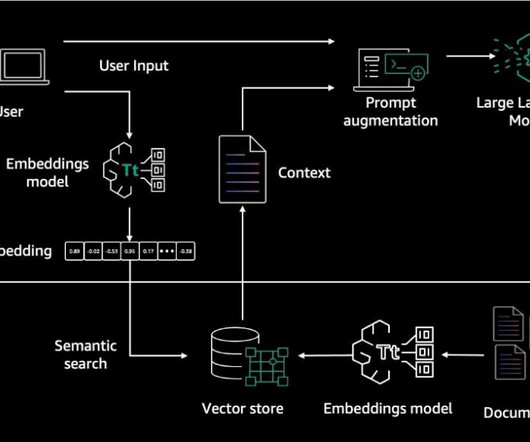
To find an answer, RAG takes an approach that uses vector search across the documents. Rather than scanning every single document to find the answer, with the RAG approach, you turn the texts (knowledge base) into embeddings and store these embeddings in the database. Generate questions from the document using an Amazon Bedrock LLM.
Here are some things to look for with this metric: How many chats are agents accepting as opposed to rejecting or passing off to other agents? We’ll look more at the average handle time metric later. You can analyze this metric by viewing your chat volume report. You can check out this metric in the agent workload report.
These scorecards typically encompass a range of key employee and customer experience KPIs and metrics specific to the agent’s responsibilities. Metrics may include factors like average handling time, first contact resolution, customer satisfaction scores, and adherence to scripts or guidelines.
We organize all of the trending information in your field so you don't have to. Join 97,000+ users and stay up to date on the latest articles your peers are reading.
You know about us, now we want to get to know you!
Let's personalize your content
Let's get even more personalized
We recognize your account from another site in our network, please click 'Send Email' below to continue with verifying your account and setting a password.


Let's personalize your content