This site uses cookies to improve your experience. To help us insure we adhere to various privacy regulations, please select your country/region of residence. If you do not select a country, we will assume you are from the United States. Select your Cookie Settings or view our Privacy Policy and Terms of Use.
Cookie Settings
Cookies and similar technologies are used on this website for proper function of the website, for tracking performance analytics and for marketing purposes. We and some of our third-party providers may use cookie data for various purposes. Please review the cookie settings below and choose your preference.
Used for the proper function of the website
Used for monitoring website traffic and interactions
Cookie Settings
Cookies and similar technologies are used on this website for proper function of the website, for tracking performance analytics and for marketing purposes. We and some of our third-party providers may use cookie data for various purposes. Please review the cookie settings below and choose your preference.
Strictly Necessary: Used for the proper function of the website
Performance/Analytics: Used for monitoring website traffic and interactions
The best way to get started is by tracking and monitoring call center metrics. What Are Important Call Center Metrics to Measure? Call center metrics provide insight into the customer experience and quantify agent productivity. Here are 30 important metrics you can track to ensure your call center achieves its goals.
As an organization’s customer experience efforts mature, CX metrics become a critical guidepost for all of its activities. You can see different ways to download this infographic below. Here are links to download different versions of the infographic: Infographic: in .png png format, in .pdf pdf format 18? poster: in .jpg
As your company begins to scale customer experience operations, it is possible for silos that cause different departments to use separate technologies and focus on different metrics, which fragments your understanding of the customer experience. If it doesn’t, click on the download button. Download Now Exit this form 3.
Spotify saw app downloads increase by 200% during the campaign, along with a surge in active users. Demand Metric ) Expanded Case Study: IKEAs AR Revolution IKEAs “Place” app transformed the way consumers interact with furniture online. The result?
Do loyalty metrics need to be reassessed? Download this eBook and discover how to adjust to get more from your customer feedback right now! They wonder: Does Net Promoter Score® (NPS) still have the same predictive power. Have the drivers of customer experience changed?
For example, key metrics like CSAT help you improve aspects of your business to satisfy specific customer needs. Thank you Your download will begin shortly. If it doesn’t, click on the download button. Download Now Exit this form How To Analyze Data From VOC? It enables informed decision-making for CX teams.
Measuring just a piece of this journey can seem short-sighted or not as powerful as other CX metrics, like Net Promoter Score (NPS). CX shouldn’t ever be measured by one metric alone. Customers and their experiences are complex and nuanced, so there’s no perfect metric. Download the Toolkit. Get Calculator.
To mitigate these challenges, your business should invest time in selecting the right customer experience outsourcing partner, ensuring alignment with their values, and establishing clear performance metrics. Thank you Your download will begin shortly. If it doesn’t, click on the download button.
Step 5: Understand Customer Sentiment While customer sentiment is usually a metric reserved for consumers who have already become customers, it can be useful in creating a customer journey map. For example, suppose you discover that consumers didn’t like the email they received after downloading a document from your website.
In the complex ecosystem of CX tools developed for disparate use cases, metrics, and processes, Verint ranked as Exemplary through thorough analysis of product and customer experience in the Index. Verint is named an Exemplary Leader in the 2023 Customer Experience Management Value Index by Ventana Research.
But “it” is a multi-layered concept, and to truly understand customer experience at scale, you may need to track three very important metrics. Of course, no single metric is going to give you a complete picture, and you will have to discover how to adapt the big three to your business case. The Three Most Popular CX Metrics.
Organizations must learn how to measure, manage, and act on customer experience KPIs and metrics so that they can deliver experiences that lead to increased loyalty, lower churn, more referrals, positive word of mouth, and higher-value customers. What Are Customer Experience KPIs and Metrics?
Download report for $195. Here’s an overview of the five customer insights trends: Download report for $195. VoC programs currently suffer from bloated surveys, isolated datasets, and outdated technology. As companies embrace these new capabilities, insights teams will need to build new skills.
If customers download your app, how many never make a purchase? Getting Real about CX Metrics When measuring the results of your CX actions, its easy for leaders to get into a cycle of measuring feedback metrics like Net Promoter Score (NPS), customer effort score, or customer satisfaction (CSAT) rate and reporting on those monthly.
Prior to working with Concentrix, Fastly faced many of the common challenges B2B organizations encounter when using a “do-it-yourself” VOC software platform: A heavy focus on reporting and brand-level metrics––with minimal changes and improvement. Read about Fastly’s success by downloading today.
The KPIs t hat m atter m ost a re s hifting The contact center success metrics are evolving beyond traditional efficiency KPIs. Performance and retention metrics like loyalty/churn propensity and customer effort score are now just as critical as operational KPIs like AHT and FCR.
The most widely used customer experience metric NPS (check what Net Promoter Score is about and how to use it for your company) actually gives all the necessary ingredients for the actionability. It is very typical that a customer experience metric is followed on leadership team level only as a number.
Read on for a snapshot of our Live Chat Benchmark Report 2022, then download the free report below to gain access to all the benchmark data you need on your journey to customer experience (CX) excellence. Download: Live Chat Benchmark Report 2022. Download the report. Download the full Live Chat Benchmark Report 2022.
Unite Your Team with this Board-Level Metric. That’s why you must get the CEO, the CMO, the sales guy, and definitely the CFO at the table so they have a voice in building this metric with you. They need to be your partners, because ultimately what we want is for this number to be a board-level metric.
Download ZoomInfo’s latest data-driven eBook aimed to help marketing leaders understand the best practices around choosing a B2B contact data provider. This buyers guide will cover: Review of important terminology, metrics, and pricing models related to database management projects. What’s involved in their maturity process?
Youll identify metrics youll track to prove these outcomes, and we explain metrics more below. Measurement : Back to metrics, youll need tools or processes to continually check in on your program’s success and see how far youve come. Each of the above examples includes CX metrics you may choose to track.
However, keeping track of numerous experiments, their parameters, metrics, and results can be difficult, especially when working on complex projects simultaneously. For example, you can give users access permission to download popular packages and customize the development environment. config_yaml = f""" SchemaVersion: '1.0'
To upload the dataset Download the dataset : Go to the Shoe Dataset page on Kaggle.com and download the dataset file (350.79MB) that contains the images. Distance metric : Select Euclidean. To do so, find the best extracted image in the local directory created when the images were downloaded. Engine : Select nmslib.
Before I answer that, let’s take a look at a popular CSAT metric that was established 25 years ago: the American Customer Satisfaction Index (ACSI). It’s interesting to take a look at this metric over time. To give you a window into how the industries fared on this metric, here are the top 10 industries based on their scores for 2018.
Do loyalty metrics need to be reassessed? Download this eBook to learn what we discovered and get the most out of your customer feedback! Common questions include: Does Net Promoter Score® (NPS) still have the same predictive power? Have the drivers of customer experience changed?
You have two options: 1) Download a raw extract of the verbatim and read through it month by month, gain an understanding of what customers are saying, then talk to the team about it. Let me give you an example—let’s say you need to understand what customers are saying about your employees each month.
Net Promoter Score® (NPS) is a trademarked metric between -100 and 100 that captures in aggregate the propensity of a company’s customers to attract and refer new business or/and repeat business. To learn more about customer satisfaction surveys and the best way to utilize them, download our free white paper here!
They have structured data such as sales transactions and revenue metrics stored in databases, alongside unstructured data such as customer reviews and marketing reports collected from various channels. Download all three sample data files. Your tasks include analyzing metrics, providing sales insights, and answering data questions.
Here are links to download different versions of the infographic: Infographic: in.jpg format, in.pdf format 18″ x 24″ poster: in.jpg format, in.pdf format Filed under: CCXP3 Organizational Adoption […]. Once again, Temkin Group is publishing a new infographic as part of our CX Day celebration.
With outcomes and metrics that align directly, find out why customer success should be the foundation of a customer marketing strategy. Customer Success teams actively track KPIs and metrics that directly align with customer marketing outcomes. Download the ebook now! How marketing to customers generates revenue.
For a more detailed analysis, be sure to download our comprehensive white paper and industry report. Continuous monitoring and analysis of performance metrics are essential for optimizing the implementation of visual service and AI. Ready to increase customer loyalty and reap the financial rewards of visual AI?
Don’t get me wrong, metrics matter, but solely focusing on score management can lead to program stagnation. Take the first step towards boosting profitability and customer satisfaction by downloading our FREE ‘101-level’ guide today! This is the validation from your customers that you have achieved integrated CX!
It’s also helpful in identifying the key metrics you need to measure to reach your objectives. Key performance indicators (KPIs) are the specific metrics you will monitor to ensure you’re on track. The post Business strategy template examples, plus free downloads appeared first on Birdeye Customer Experience Management.
Amazon Lookout for Metrics is a fully managed service that uses machine learning (ML) to detect anomalies in virtually any time-series business or operational metrics—such as revenue performance, purchase transactions, and customer acquisition and retention rates—with no ML experience required.
Download this eBook and uncover how winning organizations are tapping into the right technology to improve Customer Satisfaction, NPS, and other key metrics.
Click here to download the current industry benchmarks. Learn how to use the CSAT metric, boost loyalty, and prove the ROI of your efforts. Supermarkets: 78%. Televisions and Video Players: 83%. Postal Service: 70%. Video Streaming Service: 75%. Video-on-Demand Service: 68%. Wireless Telephone Service: 74%. is a good starting point.
The Net Promoter Score (NPS) metric reveals the essence of customer sentiment and unlocks the path to business success, so it is important that you take the time to uncover net promoter score drivers. To access all the key drivers of NPS and discover who the leading brands are in the UK, download your copy of the report findings here.
Quantitative metrics allow you to assign a number to the current state, compare it to the past, and track your company’s progress toward your goals. Managers can use those metrics to guide strategy improvements and employee training. When and how to use those metrics. However, not everything is easy to measure.
You can download (and print) this infographic in different forms: Infographic: infographic in pdf, infographic in png Poster (12″ x […]. Voice of the Customer (VoC) programs are a central part of most customer experience efforts. Here’s some interesting data snippets from the recent report, State of VoC Programs, 2016.
In this whitepaper, you’ll get in-depth insight into how companies are utilizing integrated platforms in their day-to-day operations, and which success metrics they are measuring. Download your copy now to discover how companies are future-proofing their contact centers as they adapt to remote and hybrid workforces.
You can download (and print) this infographic in different forms: Infographic: infographic in pdf, infographic in png Poster (12″ x 24″): poster in pdf, poster in png Filed under: […]. Voice of the Customer (VoC) programs are a central part of most customer experience efforts.
Take your customer segmentation to the next level with our advanced guide Download Now Why it Matters: Ensuring email deliverability is essential to the success of your upcoming holiday campaigns. Factors that impact deliverability include sender reputation, list hygiene, and engagement metrics. Your open rate is 14%.
There are a variety of different social media metrics to choose from, and the ones best for your business will depend on your marketing goals. In this article, we’ll tell you about the 13 social media metrics you should track to effectively measure the success of your campaigns. Table of contents What are social media metrics?
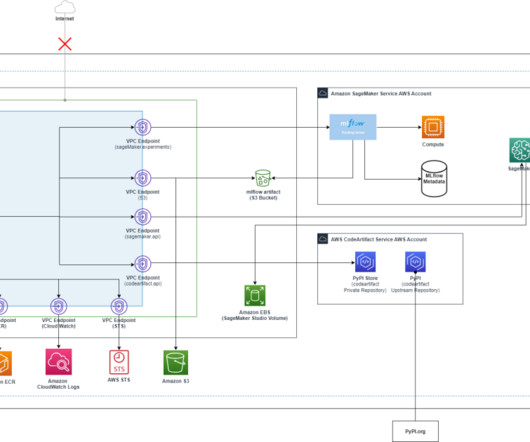
In February 2022, Amazon Web Services added support for NVIDIA GPU metrics in Amazon CloudWatch , making it possible to push metrics from the Amazon CloudWatch Agent to Amazon CloudWatch and monitor your code for optimal GPU utilization. You can add or remove any metrics as needed. Then we explore two architectures.
Download this Measuring the ROI of Enterprise Learning for Customers, Partners, and Professionals white paper to discover the metrics you can track to prove ROI in each of these critical areas.
We organize all of the trending information in your field so you don't have to. Join 97,000+ users and stay up to date on the latest articles your peers are reading.
You know about us, now we want to get to know you!
Let's personalize your content
Let's get even more personalized
We recognize your account from another site in our network, please click 'Send Email' below to continue with verifying your account and setting a password.


Let's personalize your content