This site uses cookies to improve your experience. To help us insure we adhere to various privacy regulations, please select your country/region of residence. If you do not select a country, we will assume you are from the United States. Select your Cookie Settings or view our Privacy Policy and Terms of Use.
Cookie Settings
Cookies and similar technologies are used on this website for proper function of the website, for tracking performance analytics and for marketing purposes. We and some of our third-party providers may use cookie data for various purposes. Please review the cookie settings below and choose your preference.
Used for the proper function of the website
Used for monitoring website traffic and interactions
Cookie Settings
Cookies and similar technologies are used on this website for proper function of the website, for tracking performance analytics and for marketing purposes. We and some of our third-party providers may use cookie data for various purposes. Please review the cookie settings below and choose your preference.
Strictly Necessary: Used for the proper function of the website
Performance/Analytics: Used for monitoring website traffic and interactions
Additionally, it discusses alternative measurement methods beyond traditional metrics and highlights global examples of companies excelling in CX experimentation. By continuously refining these strategies based on experimental data, businesses can enhance personalization efforts and drive customer loyalty.
[link] Introduction: Todays businesses face a pivotal question: can emerging technologies like AI and real-time data platforms reduce or even replace the need for traditional customer surveys in managing customer experience (CX)? Many businesses have grown frustrated with this one-size-fits-all metric.
In competitive B2B environments where products and prices are similar, delivering an outstanding experience can be the deciding factor for why clients choose and stay with one provider over another. Many organizations designate a specific executive owner for CX (such as a Chief Customer Officer or Chief Experience Officer) to lead the charge.
Organizations such as Google, Netflix, and Spotify excel in leveraging data analytics to enhance userexperiences and personalize offerings. Goals might include improving customer satisfaction scores, reducing churn rates, or increasing customer lifetime value.
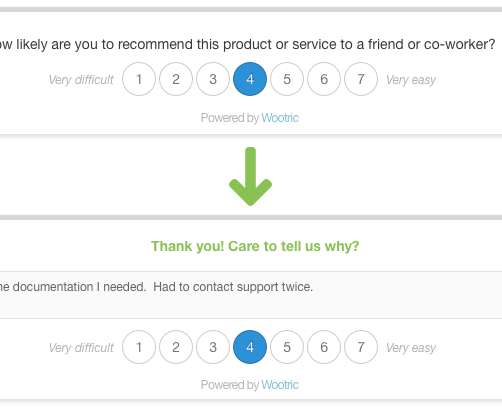
The secret to effortless customer experiences lies in understanding one simple truth: effort matters. Thats where Customer EffortScore (CES) steps in to save the day. By measuring the effort your customers expend, youre unlocking insights into what works and what doesnt. High scores mean youre on the right track.
Customer churn is a critical metric because it is much less expensive to retain existing customers than it is to acquire new customers. Customer EffortScore (CES) Customer EffortScore (CES) is a customer experiencemetric used to measure customer effort and customer satisfaction.
Companies like Apple, Hulu, and Pandora excel in leveraging data analytics to enhance userexperiences and personalize offerings. Goals might include improving customer satisfaction scores, reducing churn rates, or increasing customer lifetime value. Successful execution fosters trust and loyalty among customers.
This approach goes all-in on end user ease and productivity to drive growth, and is a radical shift away from the acquisition growth model so familiar in the software industry. Metrics are essential to understanding progress on the product led growth curve. This is where CX metrics are so valuable.
Research shows that companies leveraging advanced experimentation techniques see significant enhancements in performance metrics, such as a 20% increase in customer satisfaction and higher sales conversion rates. Identify Key Metrics : Determine which performance indicators will measure the success of your experiments.
Take NPS from a Score to a Strategic Advantage In today’s fiercely competitive business environment, customer satisfaction is paramount to success. By using the Net Promoter Score system as your compass, you can gain a better understanding of what drives customer loyalty and satisfaction.
Increased Resource Allocation Customer journey maps can help you identify problems and present a strong business case for customer experience improvement. 71% of organizations say customer journey mapping has successfully persuaded management to invest in CX efforts and fix existing customer problems.
In the sometimes lunatic world of business, companies often find themselves walking a tightrope between the relentless pursuit of growth and the need to create outstanding customer experiences. product quality, service speed, userexperience). Segment feedback into actionable categories (e.g.,
Points: Agents accumulate points for achieving specific metrics, such as call resolution time or customer satisfaction scores. Improved measurement: Gamification is naturally tied to metrics and measurement. Leaderboards: Publicly displayed rankings motivate agents to compete against each other and strive for top performance.
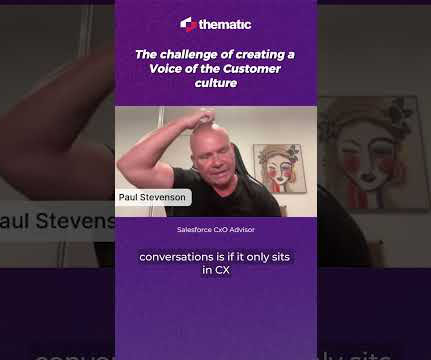
But too often we turned this exciting idea into a program of surveys that led to metrics that led to discussions about metrics that led to…not the powerful changes we expected. Your organization may select a metric to use that helps capture how customers are feeling about working with you. Net Promoter Score (NPS).
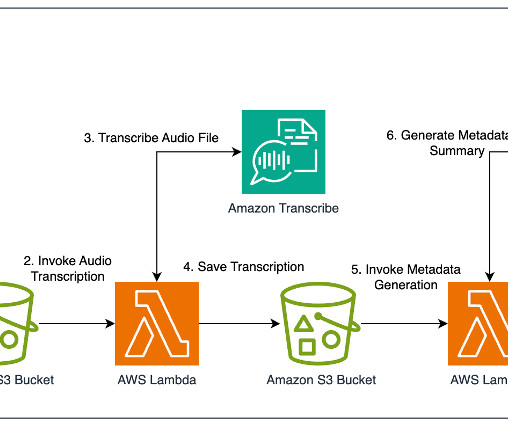
To evaluate the transcription accuracy quality, the team compared the results against ground truth subtitles on a large test set, using the following metrics: Word error rate (WER) – This metric measures the percentage of words that are incorrectly transcribed compared to the ground truth.
According to an Accenture-commissioned study by Forrester Consulting, only seven percent of business leaders think that their company’s shopping experience exceeds customer expectations. According to Forrester , a one percent increase in CX scores can translate up to $100 million in annual revenue. CX is a huge business opportunity.
doesn’t matter how many letters you throw out there or how many customer experience (CX) scores you get. If you don’t know what’s driving your CX metrics, it’s hard to replicate success, let alone find ways to improve. Why should businesses analyze CX metrics? But CX metrics on their own only scratch the surface.
In order to ensure shared accountability for product-led growth metrics, start by defining the metrics that matter most within the 5 growth pillars: Acquisition, Activation, Revenue, Retention & Referral. Utilizing Interact’s SaaS Actionable Metrics Framework can help you do this. Primary Activation Metric.
Set clear start and endpoints for your data collection efforts. In contrast, if you are running a specific campaign and need customer experience data for a limited time, then you should focus your efforts on that period. Userexperience design, to be able apply concepts such as human-centered design to cross-functional projects.
Net Promoter Score – NPS 2. Customer Satisfaction Score – CSAT 3. Customer EffortScore – CES 4. Customer Churn Rate – CCR 6 Ways To Improve Your Omnichannel Customer’s Experience 1. But a connected userexperience isn’t the only advantage of an omnichannel marketing strategy.
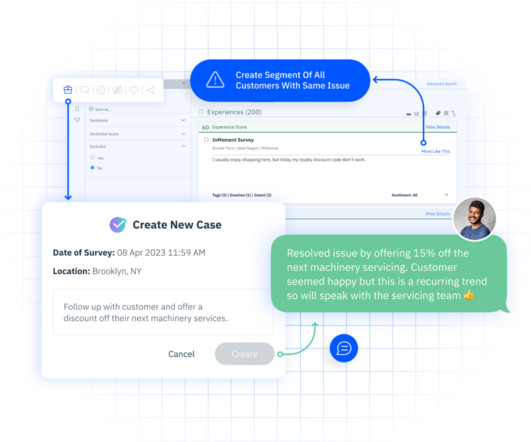
Essentially, once fortified with this extensive and comprehensive data, CX leaders can: Discover why feedback scores, such as net promoter scores are not up to par. Often, the focus is on the scores themselves instead of the reason for those ratings, so companies that use this objective will get more general feedback and causality.
And understanding, leveraging and acting on CSAT scores can absolutely help you get there. Start with measuring your CSAT score as outlined by GetFeedback. Start with measuring your CSAT score as outlined by GetFeedback. If your CSAT metric is 60%, that means 40% of your customers are at risk of defection.
We have seen the trends and uses evolve and while user expectations in terms of interactions and conversation have changed significantly, performance metrics have remained quite constant. Therefore, we have gathered the top 10 key metrics to monitor when measuring your chatbot’s performance. Userexperiencemetrics.
And for more on this subject, I suggest checking out these two additional posts: Quant Data, Qual Data: Use Just One To Derail Your CX Efforts. You need to understand your customers’ needs and expectations as completely as possible before you start making decisions about what you should change about the experience. Deliver The Journey.
When done perfectly, a holistic ecommerce customer experience approach ensures your customers have a seamless and positive experience at every touchpoint. When every level of your company prioritizes customer satisfaction, it creates a cohesive and dedicated effort to provide outstanding service.
Creating a Seamless UserExperience Creating a seamless customer experience is about ensuring customer support agents and conversational tools can directly connect customers to the next step in their journey. Look at a range of metrics and KPIs, both in terms of the customer experience and basic ones such as conversion rates.
This approach goes all-in on end user ease and productivity to drive growth, and is a radical shift away from the acquisition growth model so familiar in the software industry. Metrics are essential to understanding progress on the product led growth curve. This is where CX metrics are so valuable.
Survey tools, for instance, enable businesses to gather structured data through questionnaires, measuring metrics like NPS, CSAT, and CES. In the contact center, this can also include quality assurance scores and other agent performance insights. Customer interaction scoring for quality assurance.
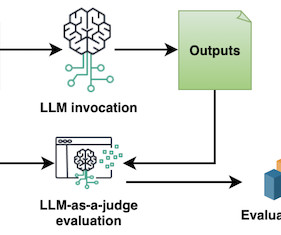
This post focuses on evaluating and interpreting metrics using FMEval for question answering in a generative AI application. FMEval is a comprehensive evaluation suite from Amazon SageMaker Clarify , providing standardized implementations of metrics to assess quality and responsibility. Question Answer Fact Who is Andrew R.
User-Friendly Website Design and optimize your website for ease of use. A clutter-free and visually appealing layout enhances userexperience and encourages visitors to explore and make purchases. Personalization Leverage data analytics and customer insights to personalize the online shopping experience.
For example, your objective might be “to improve our NPS (Net Promoter Score) by 10 points in the next year by addressing top customer pain points.” Clear objectives keep your efforts customer-centric and business-focused. This insight helped Melodics prioritize improving app performance, leading to higher user retention.
But without numbers or metric data in hand, coming up with any new strategy would only consume your valuable time. For example, you need access to metrics like NPS, average response time and others like it to make sure you come up with relevant strategies that help you retain more customers. 4: Net Promoter Score (NPS). #5:
Or spending months refining a service only to see your customer satisfaction scores plummet. They need a structured way to understand their customers, anticipate needs, and improve the userexperience, so they need a customer insights framework. Track NPS, CSAT, churn rate, and engagement metrics to gauge success.
You can measure it by using various customer engagement metrics into consideration. 10 Key Customer Engagement Metrics . Customer Engagement Metrics are crucial indicators of how your business is faring in terms of engagement. Here are the top 10 customer engagement metrics that you should know about.
Retently: The All-in-One Customer Satisfaction Platform Retently is a versatile customer experience management platform designed to help businesses measure, analyze, and enhance customer satisfaction. Best Fit For: Typeform is best suited for businesses that prioritize userexperience in their data collection efforts.
The following feedback metrics enable businesses to quickly identify areas for improvement without intimidating new customers: Net Promoter Score (NPS) is a customer loyalty metric that measures how likely customers are to recommend a product or service to their colleagues, typically on a scale of 1-10. Keep it simple.
Being online with your business evens the playing field; having a great digital customer experience puts your brand on top. Factors that Impact Digital Experience Because digital experience is an extension of customer experience, it is shaped by many of the same factors.
Starting a business and knowing that an audience is ready to buy your product considerably eases sales and marketing efforts. When one has found the right market, it can devote its efforts to expanding in that market and developing new products that will appeal to the same audience.
Many organizations struggle to consistently create and effectively evaluate their prompts across their various applications, leading to inconsistent performance and userexperiences and undesired responses from the models. Respond only with a JSON having: - An 'answer-score' key with the score number you evaluated the answer with. -
These exceptional experiences are the result of careful attention to two crucial elements: customer experience (CX) and userexperience (UX). Let’s dive into the realm of customer experience vs. userexperience. What is Customer Experience? What is UserExperience?
Customize widgets to track your net promoter score (NPS) , customer satisfaction scores, or other key metrics, and see the impact of your actions over time. Atlassian: Scaling Customer Feedback Analysis Atlassian , a leader in team collaboration tools, faced an overwhelming amount of user feedback. The result?
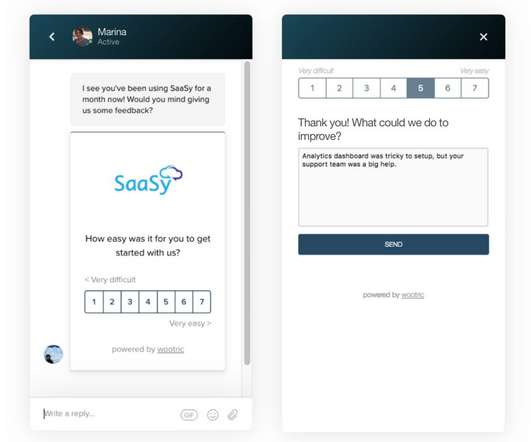
We actually recommend conducting microsurveys whenever possible—those short, two questions surveys that are used to gather common metrics like Net Promoter Score , Customer EffortScore , Customer Satisfaction, and Product Satisfaction. Openly discuss your surveys + improvement efforts. Net Promoter Score (NPS).
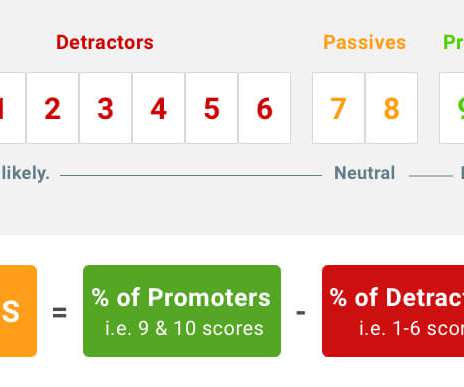
NPS is one of the most popular metrics and measures customer loyalty. Naturally, the higher the score, the more satisfied customers are. The NPS score is the difference in percentage between Promoters and Detractors. CSAT product usability survey The most relevant customer satisfaction metrics at this point are CSAT and CES.
To measure the impact of your efforts, detailed reporting gives you insights into delivery rates, engagement metrics, and overall campaign performance, enabling data-driven decisions. Consider this scenario: Your users are eagerly following a live football game. This builds trust and keeps customers informed.
We organize all of the trending information in your field so you don't have to. Join 97,000+ users and stay up to date on the latest articles your peers are reading.
You know about us, now we want to get to know you!
Let's personalize your content
Let's get even more personalized
We recognize your account from another site in our network, please click 'Send Email' below to continue with verifying your account and setting a password.


Let's personalize your content